admin
admin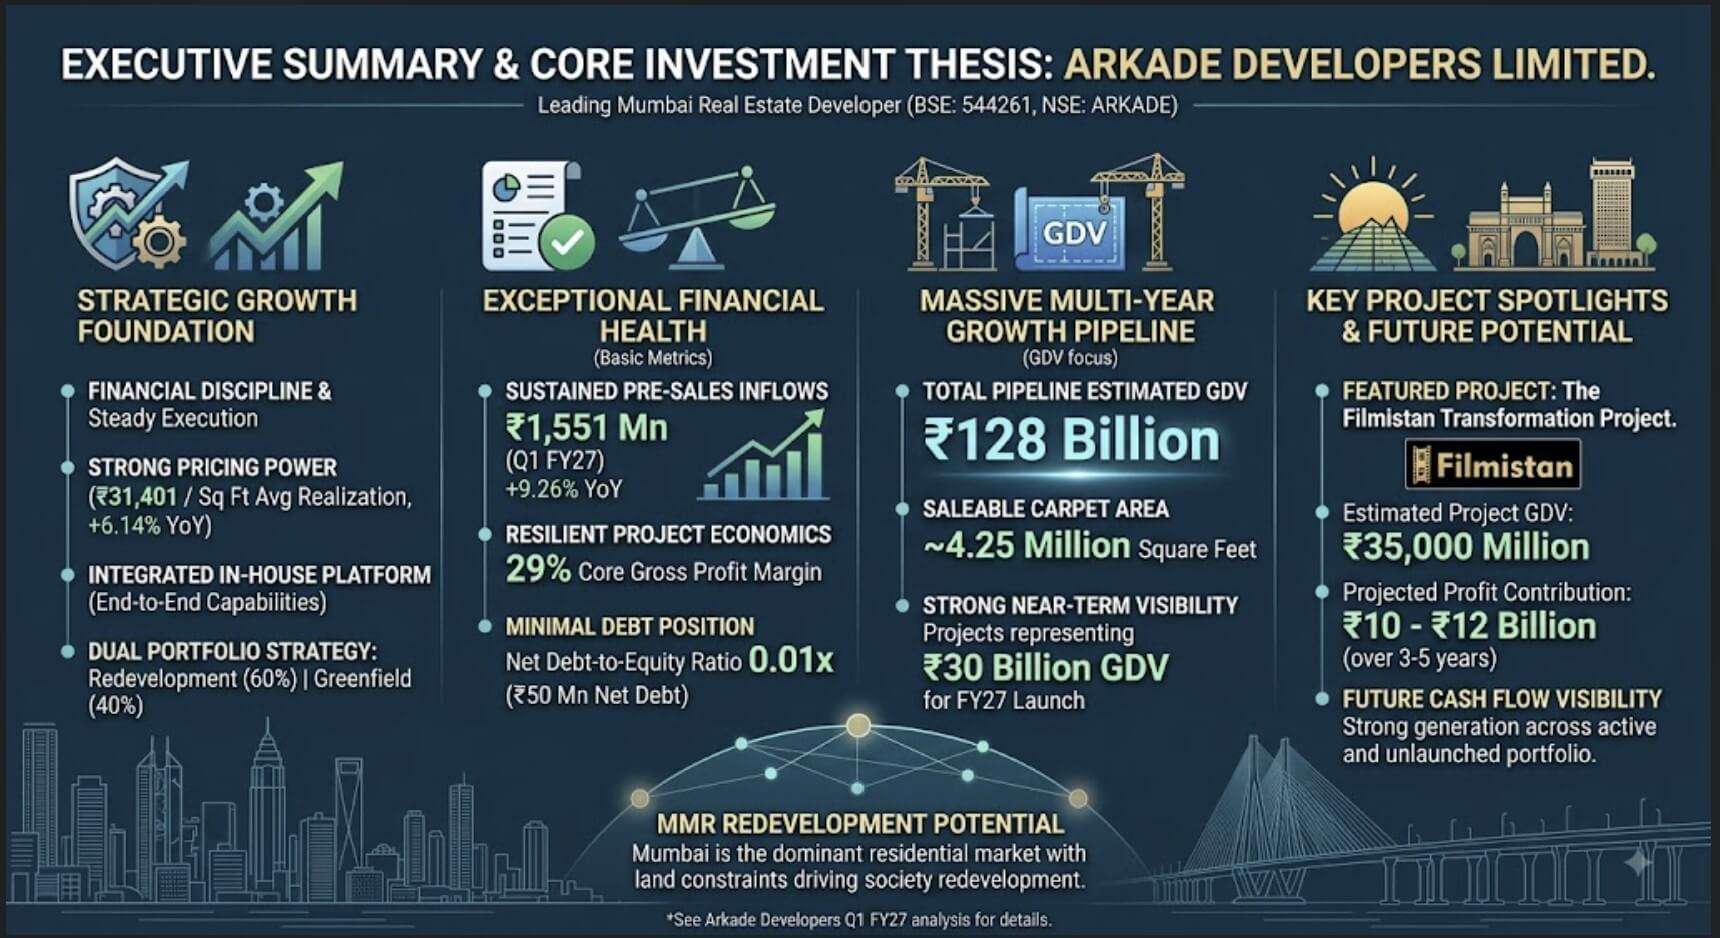
Executive Summary & Core Investment Thesis
A detailed Arkade Developers Analysis reveals a corporate growth strategy focused on financial discipline, strong pricing power, and steady execution[cite: 1]. Listed on both the BSE (Scrip Code: 544261) and NSE (Symbol: ARKADE), Arkade Developers Limited is a leading real estate developer headquartered in Mumbai[cite: 1].
- Sustained Pre-Sales Inflows: Pre-sales booking value reached ₹1,551 million in Q1 FY27, marking a 9.26% year-on-year (YoY) increase from ₹1,420 million reported in Q1 FY26
- Resilient Project Economics: Core gross profit margin stood at 29%, demonstrating strong underlying unit-level profitability across key micro-markets despite net earnings moderation
- Exceptional Balance Sheet Health: Net debt remained minimal at ₹50 million as of June 30, 2026, maintaining a low Net Debt-to-Equity ratio of 0.01x
- Massive Multi-Year Growth Pipeline: The total development pipeline stands at an estimated Gross Development Value (GDV) of ₹128 billion across ~4.25 million square feet of saleable carpet area
- Near-Term Launch Visibility: Projects representing an estimated GDV of ₹30 billion are scheduled for launch during FY27
Business Model & Competitive Landscape
Arkade Developers brings nearly four decades of operational legacy to the Mumbai real estate market[cite: 1]. Since its incorporation, the group has delivered more than 5.5 million square feet of space to over 5,500 families across 32 completed projects
Integrated In-House Platform
- End-to-End Capabilities: Arkade operates a fully integrated in-house development engine spanning land acquisition, legal due diligence, design approvals, procurement, construction management, sales, and post-delivery services[cite: 1].
- Execution Track Record: In-house project management enables consistent delivery prior to scheduled RERA deadlines[cite: 1]. For instance, Arkade Eden achieved 100% completion ahead of its official timeline[cite: 1].
- Ecosystem Services: Arkade has expanded value-added services such as Arkade Finroof (banking and home loan assistance) and Assist 360 (facility management) to drive customer retention[cite: 1].
Dual Portfolio Strategy
- Society Redevelopment (60% of Portfolio): Offers asset-light growth, fast capital turnaround, and strategic entry into high-density western and eastern suburbs where fresh land is scarce[cite: 1].
- Greenfield Developments (40% of Portfolio): Delivers higher development scale, brand visibility, and substantial long-term cash flow potential[cite: 1].
Detailed Arkade Developers Analysis: Q1 FY27 Financial Performance
The consolidated financial statements for Q1 FY27 reflect revenue timing dynamics inherent to real estate accounting under project completion milestone schedules[cite: 1].
| Consolidated Financial Particulars | Q1 FY27 | Q1 FY26 | Q4 FY26 | YoY Change (%) |
| Revenue from Operations | ₹1,470 Mn | ₹1,594 Mn | ₹1,966 Mn | -7.8% |
| Operating Expenses | ₹1,192 Mn | ₹1,252 Mn | ₹1,587 Mn | -4.8% |
| EBITDA | ₹278 Mn | ₹342 Mn | ₹379 Mn | -18.7% |
| EBITDA Margin (%) | 18.91% | 21.46% | 19.28% | -255 bps |
| Depreciation | ₹32 Mn | ₹19 Mn | ₹29 Mn | +68.4% |
| Finance Costs | ₹2 Mn | ₹2 Mn | ₹3 Mn | 0.0% |
| Other Income | ₹17 Mn | ₹58 Mn | ₹25 Mn | -70.7% |
| Profit Before Tax (PBT) | ₹261 Mn | ₹379 Mn | ₹371 Mn | -31.1% |
| Profit After Tax (PAT) | ₹191 Mn | ₹288 Mn | -₹1,096 Mn* | -33.7% |
| PAT Margin (%) | 12.99% | 18.07% | N/A | -508 bps |
| Diluted EPS (INR) | ₹1.03 | ₹1.55 | -₹5.90 | -33.5% |
*Q4 FY26 PAT was impacted by exceptional items of ₹1,822 million[cite: 1].
Primary Revenue and Profitability Drivers
- Revenue Recognition Schedules: Consolidated revenue from operations reached ₹1,470 million in Q1 FY27 compared to ₹1,594 million in Q1 FY26[cite: 1]. Because real estate accounting recognizes revenue upon reaching specific completion milestones, revenue fluctuates between quarters independently of booking activity[cite: 1].
- EBITDA Margin Compression: Operating EBITDA margin came in at 18.91% (down 255 basis points YoY)[cite: 1]. This moderation reflects fixed corporate overheads incurred to build execution capacity ahead of major project launches[cite: 1].
- Treasury Yield Normalization: Other income contracted 70.7% YoY from ₹58 million to ₹17 million[cite: 1]. In Q1 FY26, the company earned returns on unutilized IPO proceeds, which have since been deployed into project execution and land purchases[cite: 1].
- Strategic Capability Expansion: Personnel expenses grew as full-time headcount expanded from 213 in June 2025 to 277 in June 2026, strengthening architectural, legal, and operational teams[cite: 1].
Operational Key Performance Indicators (KPIs)
Operational metrics highlight sustained consumer demand and strong pricing power across Mumbai sub-markets[cite: 1].
| Operational Parameter | Q1 FY27 | Q1 FY26 | Q4 FY26 | YoY Change (%) |
| Pre-sales Value | ₹1,551 Mn | ₹1,420 Mn | ₹3,030 Mn | +9.26% |
| Collections | ₹1,640 Mn | ₹1,700 Mn | ₹1,950 Mn | -3.53% |
| Area Sold | 0.49 Lakh Sq Ft | 0.48 Lakh Sq Ft | 1.09 Lakh Sq Ft | +2.93% |
| Units Sold | 60 | 65 | 142 | -7.69% |
| Average Realization Price | ₹31,401 / Sq Ft | ₹29,584 / Sq Ft | ₹27,545 / Sq Ft | +6.14% |
Operational Analysis Insights
- Surging Price Realizations: Average selling prices increased 6.14% YoY to ₹31,401 per square foot, driven by strong demand in Vile Parle, Goregaon, and Mulund[cite: 1].
- Collection Stability: Cash collections stood at ₹1,640 million during the quarter, creating steady internal cash flows to fund ongoing construction work[cite: 1].
- Multi-Year Sales Momentum: Over the past five years, Arkade has delivered a pre-sales CAGR of 44% and a collections CAGR of 25%[cite: 1].
Historical Financials & Balance Sheet Stability
Arkade’s multi-year performance illustrates steady balance sheet strengthening and operational scaling[cite: 1].
| Historical Financial Highlights | FY24 | FY25 | FY26 | Q1 FY27 |
| Revenue from Operations | ₹6,347 Mn | ₹6,831 Mn | ₹8,164 Mn | ₹1,470 Mn |
| EBITDA | ₹1,674 Mn | ₹2,061 Mn | ₹1,891 Mn | ₹278 Mn |
| EBITDA Margin (%) | 26.37% | 30.17% | 23.16% | 18.91% |
| Profit After Tax (PAT) | ₹1,229 Mn | ₹1,569 Mn | ₹53 Mn* | ₹191 Mn |
| Net Worth | ₹3,236 Mn | ₹8,839 Mn | ₹8,822 Mn | N/A |
| Net Debt / Equity Ratio | 0.17x | -0.03x | 0.08x | 0.01x |
| Return on Capital Employed (ROCE) | 52.66% | 32.31% | 19.64% | N/A |
| Return on Equity (ROE) | 46.92% | 25.99% | 21.23% | N/A |
*FY26 net profit reflects an exceptional item of ₹1,822 million[cite: 1]. ROCE and ROE figures are adjusted for exceptional items[cite: 1].
Comprehensive Portfolio & GDV Analysis
Arkade maintains a strategic balance across ongoing execution and high-potential upcoming project acquisitions[cite: 1].
Ongoing Projects Summary (Total GDV: ₹23.12 Billion)
The company is executing 8 ongoing projects covering 8,36,252 square feet of saleable area[cite: 1]. Total sales value booked across these active developments reached ₹16,043 million[cite: 1].
| Project Name | Location | Type | Total GDV | Saleable Area | Completion % | Expected Completion |
| Arkade Eden | Malad (W) | Redevelopment | ₹1,500 Mn | 49,981 sq ft | 100% | Mar ’26[cite: 1] |
| Arkade Pearl-I | Vile Parle (E) | Redevelopment | ₹2,500 Mn | 60,332 sq ft | 98% | Dec ’26[cite: 1] |
| Arkade Nest | Mulund (W) | Greenfield | ₹6,300 Mn | 2,49,163 sq ft | 75% | Jun ’27[cite: 1] |
| Arkade Pearl-II | Vile Parle (E) | Redevelopment | ₹650 Mn | 14,813 sq ft | 64% | Jun ’27[cite: 1] |
| Arkade Rare | Bhandup (W) | Greenfield | ₹7,600 Mn | 3,13,070 sq ft | 68% | Dec ’27[cite: 1] |
| Arkade Vistas | Goregaon (E) | Redevelopment | ₹2,070 Mn | 71,800 sq ft | 58% | Dec ’27[cite: 1] |
| Arkade Views | Goregaon (E) | Redevelopment | ₹350 Mn | 10,160 sq ft | 65% | Dec ’27[cite: 1] |
| Arkade Evoke | Goregaon (W) | Redevelopment | ₹2,150 Mn | 66,933 sq ft | 33% | Jun ’29[cite: 1] |
Upcoming Projects Pipeline (Total GDV: ₹127.85 Billion)
Arkade has accumulated a prospective development pipeline of 12 projects across major suburban hubs[cite: 1]:
- Maheshwari Niwas (Santacruz West): ₹2,100 Mn GDV | 41,140 sq ft carpet area | Planned Launch: Q2 FY27[cite: 1]
- Nutan Ayojan (Malad West): ₹7,400 Mn GDV | 2,33,000 sq ft carpet area | Planned Launch: Q3 FY27[cite: 1]
- Kasarvadavali (Thane): ₹19,000 Mn GDV | 9,26,459 sq ft carpet area | Planned Launch: Q4 FY27[cite: 1]
- Filmistan Land Parcel (Goregaon West): ₹35,000 Mn GDV | 8,87,548 sq ft carpet area | Planned Launch: Q1 FY28[cite: 1]
- Woollen Mills (Bhandup West): ₹10,000 Mn GDV | 4,26,000 sq ft carpet area | Planned Launch: Q2 FY28[cite: 1]
- Jal Ratna (Goregaon West): ₹3,500 Mn GDV | 86,810 sq ft carpet area | Planned Launch: Q4 FY28[cite: 1]
- Satya Shripal (Borivali West): ₹8,000 Mn GDV | 2,39,100 sq ft carpet area | Planned Launch: Q1 FY29[cite: 1]
- Rani Sati (Malad West): ₹7,250 Mn GDV | 2,11,940 sq ft carpet area | Planned Launch: Q2 FY29[cite: 1]
- Anand Nagar (Dahisar East): ₹17,000 Mn GDV | 6,76,000 sq ft carpet area | Planned Launch: FY29[cite: 1]
- Jumbo Darshan (Andheri East): ₹3,850 Mn GDV | 1,04,100 sq ft carpet area | Planned Launch: FY29[cite: 1]
- Apna Ghar (Andheri West): ₹3,750 Mn GDV | 92,815 sq ft carpet area | Planned Launch: FY29[cite: 1]
- Ashok Nagar (Kandivali East): ₹11,000 Mn GDV | 3,25,000 sq ft carpet area | Planned Launch: FY29[cite: 1]
Spotlight: The Filmistan Transformation Project
The acquisition of the 4-acre Filmistan site in Goregaon West represents a major strategic milestone[cite: 1]:
- Estimated Project GDV: ₹35,000 Million[cite: 1]
- Projected Profit Contribution: Estimated bottom-line contribution of ₹10 to ₹12 billion over a 3-to-5-year development lifecycle[cite: 1].
- Market Impact: Establishes a landmark ultra-luxury project in Mumbai’s Western Suburbs, enhancing brand prestige and pricing power[cite: 1].
Future Cash Flow Visibility
Arkade possesses strong cash generation potential across its active portfolio and unlaunched pipeline[cite: 1]:
| Cash Flow Realization Category | Potential Value (INR Millions) |
| Pending Collections from Launched Sold Units | ₹5,590 Mn |
| Estimated Realization from Launched Unsold Inventory | ₹6,968 Mn |
| Unsold Inventory from Completed Projects | ₹111 Mn |
| Pending Collections from Completed Sold Units | ₹191 Mn |
| Prospective Realization from Unlaunched Pipeline | ₹127,850 Mn |
| Total Estimated Cash Flow Potential | ₹140,710 Mn |
Macro Context: Why MMR Redevelopment Holds Strong Potential
An analysis of industry trends highlights structural drivers supporting Arkade’s business model[cite: 1]:
- Dominant Residential Market: The Mumbai Metropolitan Region (MMR) led major Indian cities in 2025 with 97,188 residential unit sales, surpassing Bengaluru (55,373), NCR (52,452), and Pune (50,881)[cite: 1].
- Redevelopment Landscape: Land constraints make society redevelopment the primary source of supply in urban Mumbai, accounting for 60% to 65% of MMR’s overall residential pipeline and 80% to 85% in the Western Suburbs[cite: 1].
- Infrastructure Drivers: Infrastructure expansion—including the Coastal Road, Metro lines, Atal Setu (MTHL), and Navi Mumbai International Airport—continues to support residential values[cite: 1].
Key Risk Factors & Investment Considerations
- Statutory Clearance Risks: Project launch schedules depend on municipal permissions and tenancy consents for redevelopment sites[cite: 1].
- Raw Material Volatility: Fluctuations in cement, steel, and contractor labor rates could exert pressure on operating margins[cite: 1].
- Geographic Focus: Concentration in MMR micro-markets exposes revenues to localized policy updates or market shifts[cite: 1].
Strategic Summary & Growth Outlook
This Arkade Developers Analysis highlights a company positioned to benefit from structural redevelopment demand in Mumbai[cite: 1]. Supported by a low Net Debt-to-Equity ratio of 0.01x, strong pricing power at ₹31,401/sq ft, and a multi-year pipeline valued at ₹128 billion GDV, Arkade Developers offers clear long-term growth visibility[cite: 1].
Disclaimer: The projections of potential returns are based on current market conditions and company performance. Actual results may vary due to various factors, including market dynamics, economic conditions, and changes in the competitive landscape. Investors should conduct their own research and consult with financial advisors before making investment decisions.
Multibagger Stocks breakout stocks
⚠️ Not SEBI Registered—just here to share insights | 🚫 No paid services—everything shared is entirely free! 🧠 Always Learning and excited to grow together in this journey of market exploration.
📲 Join Our Investor Communities
🔹 Join our Telegram Channel: Multibagger Hunts
🔹 Join our WhatsApp Channel: Click to Join
✅ Free access
✅ Instant alerts
✅ Curated research for serious investors
Supply Chain Management
TwitterXWhatsAppThreadsTelegramFacebookLinkedInGmailEmailShare