admin
admin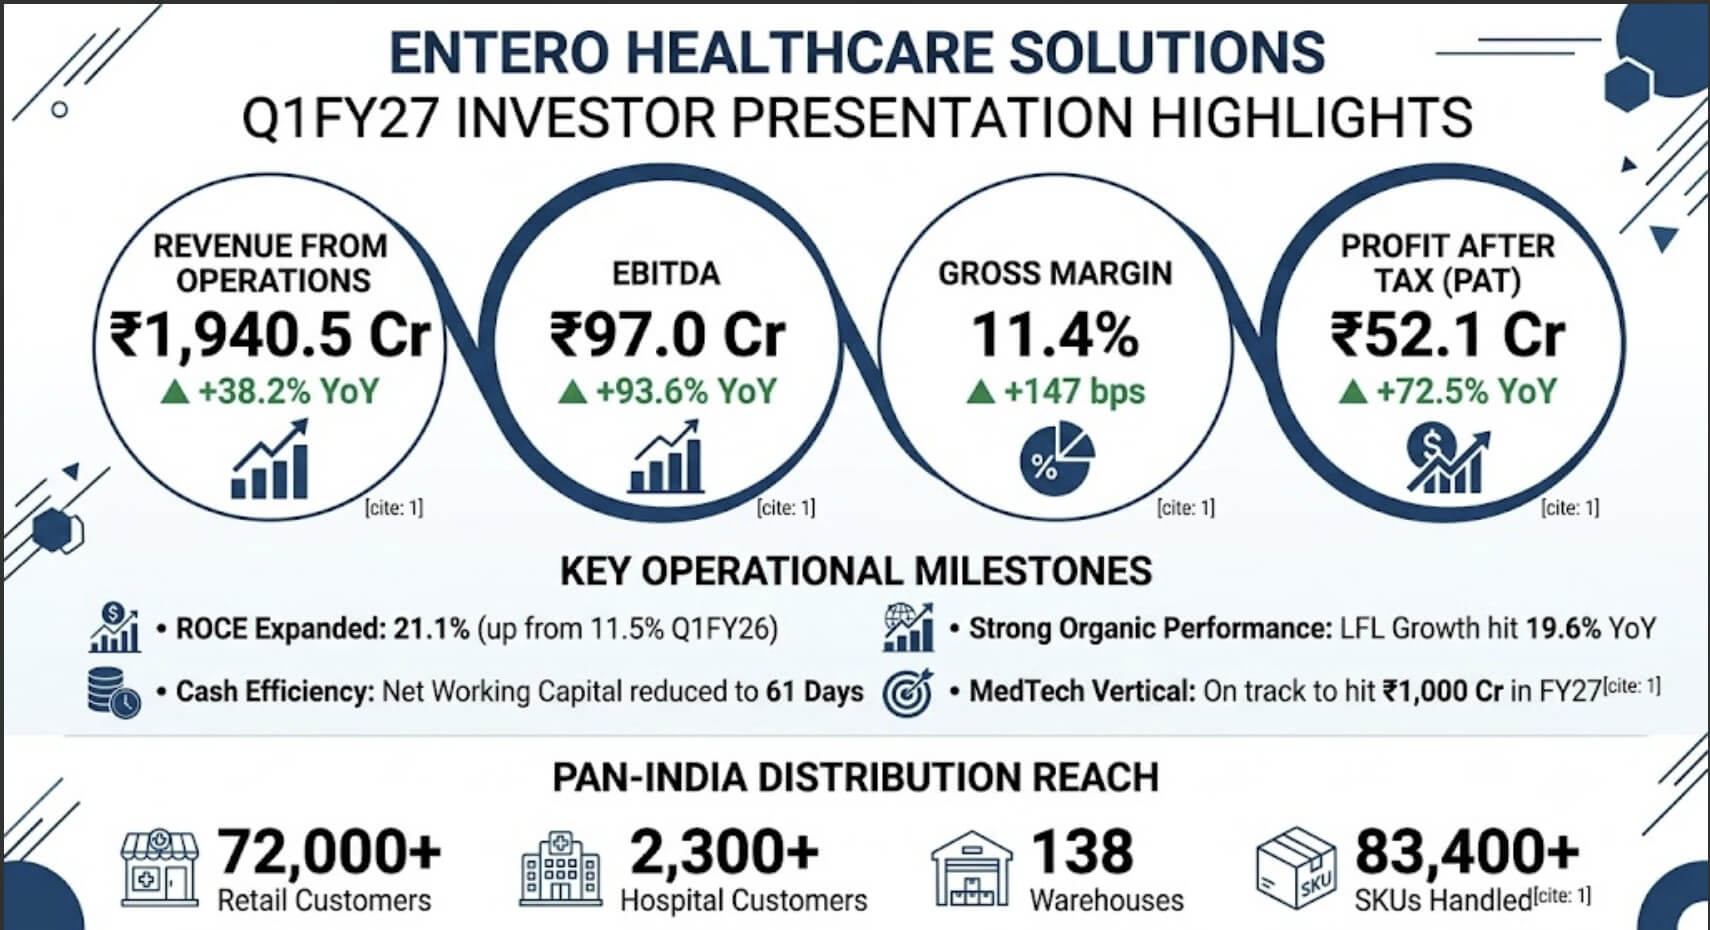
Entero Healthcare Q1FY27 Analysis: Financial Performance, Strategy, and Investor Outlook
Entero Healthcare Solutions Limited has reported its financial and operational performance for the first quarter of FY27 (ended June 30, 2026). The company continues to show significant scale, driven by organic growth in core pharmaceutical distribution and expansion across its hospital and retail network.
This deep-dive analysis evaluates Entero Healthcare’s revenue drivers, margin dynamics, balance sheet metrics, expansion strategy, and key operational risks to evaluate its long-term investment profile.
Executive Summary & Performance Overview
Entero Healthcare sustained double-digit top-line momentum while achieving operational leverage across its core business lines. The company’s focus on consolidating India’s fragmented healthcare supply chain through a hybrid model of organic distribution and strategic consolidation remains its core engine of growth.
Q1FY27 Key Metric Breakdown
| Financial Metric | Q1FY27 | Q1FY26 | YoY Change (%) | Strategic Takeaway |
| Revenue from Operations | ₹1,940.5 Cr | ₹1,403.8 Cr | +38.2% | Driven by organic volume gains and past acquisition integration. |
| LFL Organic Growth | 19.6% | — | — | Outperformed broader Indian Pharma Market (IPM) rates. |
| Gross Profit | ₹221.4 Cr | ₹139.6 Cr | +58.6% | Margin expanded due to higher-value product mix. |
| Gross Margin | 11.4% | 9.9% | +147 bps | Reflects better purchasing power and product tiering. |
| EBITDA | ₹97.0 Cr | ₹50.1 Cr | +93.6% | Strong operational leverage across distribution hubs. |
| EBITDA Margin | 5.0% | 3.6% | +143 bps | Warehouse consolidation improved per-unit cost efficiency. |
| Profit After Tax (PAT) | ₹52.1 Cr | ₹30.2 Cr | +72.5% | Net profitability expanded despite working capital funding needs. |
| PAT Margin | 2.7% | 2.2% | +50 bps | Flow-through benefits from EBITDA operational gains. |
| PAT (Owners’ Share) | ₹38.2 Cr | ₹27.8 Cr | +37.4% | Reflects non-controlling interest deductions from acquisitions. |
| Basic EPS | ₹8.77 | ₹6.39 | +37.2% | Shareholder earnings expanded alongside underlying profits. |
Revenue Analysis: Organic Drivers & Market Share Gains
Entero Healthcare’s revenue grew 38.2% YoY (40.0% on a like-for-like basis) to hit ₹1,940.5 Crore. Understanding where this growth originates is critical for predicting its sustainability:
                          Q1FY27 REVENUE GENERATION
                                     │
           ┌─────────────────────────┴─────────────────────────┐
           ▼                                                   ▼
  Organic Growth (~19.6%)                            Inorganic Consolidation
  • Retailer density gains                           • Integration of past acquisitions
  • SKU expansion per chemist                        • Full-quarter regional contributions
  • Hospital supply contracts                        • Expanded geographic footprint
- IPM Outperformance: The company’s organic Like-For-Like (LFL) revenue growth of 19.6% significantly outpaced the overall Indian Pharmaceutical Market (IPM), which historically moves in the high single digits.
- Hospital & Retail Penetration: Entero added broader coverage across pharmacy and hospital accounts, providing higher density per distribution route.
- Product Catalog Breadth: Handling 83,400+ SKUs allows Entero to act as a primary vendor for retail pharmacies, capturing a larger share of wallet per customer compared to regional distributors.
For detailed analysis on sector trends and broader market context, explore our internal Healthcare Sector Market Reports for comprehensive industry breakdowns.
Profitability & Margin Dynamics: Unpacking Operational Leverage
Profitability saw substantial improvement, with EBITDA growing 93.6% YoY to ₹97.0 Crore and PAT increasing by 72.5% YoY to ₹52.1 Crore.
                               MARGIN EXTENSION

  Q1FY26 Gross Margin: 9.9% ──────────────► Q1FY27 Gross Margin: 11.4% (+147 bps)
  Q1FY26 EBITDA Margin: 3.6% ──────────────► Q1FY27 EBITDA Margin: 5.0% (+143 bps)
Key Factors Behind Margin Expansion
- Direct Manufacturer Sourcing: Entero maintains direct distribution relationships with over 3,000 healthcare product manufacturers. Cutting out intermediate tiers improves gross realization rates.
- Warehouse Sourcing Efficiencies: With 138 warehouses spanning 6,71,907 sq. ft., Entero achieves lower logistics costs per order as shipment volume scales across its network.
- High-Margin Product Segments: Broader distribution of specialized MedTech equipment and private label offerings carries structural gross margin advantages compared to traditional acute-care generic distribution.
Balance Sheet Efficiency & Return Metrics
In wholesale distribution, capital efficiency and working capital controls are primary determinants of cash flow generation.
Return Ratios & Capital Efficiency Comparison
| Capital Metric | Q1FY27 | Q1FY26 | Directional Change | Investor Significance |
| Return on Capital Employed (ROCE) | 21.1% | 11.5% | +960 bps | Indicates higher operating profit generated per unit of capital. |
| Return on Equity (ROE) | 20.4% | 9.0% | +1140 bps | Highlights improving bottom-line efficiency for equity shareholders. |
| Net Working Capital Cycle | 61 Days | 66 Days | -5 Days | Reduced inventory holding and faster collection cycles. |
                       WORKING CAPITAL EFFICIENCY CYCLE

  [ Q1FY26: 66 Days ] ──► (Inventory Optimization & AR Collections) ──► [ Q1FY27: 61 Days ]
The 5-day reduction in net operating working capital is meaningful. In distribution businesses, lower cash-conversion cycles free up operating cash flow to support balance sheet stability without requiring high levels of short-term debt financing.
Distribution Scale & Network Footprint
Entero Healthcare’s business model relies on its pan-India distribution network, which serves as a supply moat against smaller localized competitors.
                         ENTERO DISTRIBUTION INFRASTRUCTURE

     Pharmacies Served          Hospital Partners          Warehouse Footprint
       72,000+            2,300+         138 Facilities
               │                            │                            │
               └────────────────────┬───────┴────────────────────────────┘
                                    ▼
                       475+ Districts Covered Across
                       19+ States & UTs
Network Dimensions
- Customer Base: Reaches over 72,000 retail pharmacy accounts and 2,300 hospital networks across India.
- Geographic Coverage: Operations cover 45 cities and more than 475 districts within 19 states and Union Territories.
- Manufacturer Partners: Direct distribution arrangements with 3,000+ pharma and healthcare OEMs.
- Product Catalog: Handles a total catalog exceeding 83,400 active SKUs.
Segment Focus: Growth in MedTech Solutions
A key operational focus for Entero Healthcare is expanding its non-pharma distribution verticals, particularly MedTech equipment and medical consumables.
- Revenue Projections: Management projects its MedTech segment revenue to cross ₹1,000 Crore in FY27.
- Margin Contributions: MedTech products generally command higher gross margins compared to traditional pricing-regulated pharmaceuticals, supporting long-term structural margin enhancement.
- Hospital Integration: Deepening ties with over 2,300 hospitals provides a ready channel for scaling specialized medical device distribution.
For regulatory filings, corporate releases, and official financial updates directly from the source, consult the Entero Healthcare Investor Relations Page.
Corporate Governance & Executive Leadership
Entero Healthcare’s executive team consists of healthcare and supply chain industry leaders:
                            LEADERSHIP STRUCTURE

    Prabhat Agrawal ────────────────────────► MD & Chief Executive Officer
    Prem Sethi ─────────────────────────────► Whole-time Director & COO
    Balakrishnan Natesan Kaushik ───────────► Group Chief Financial Officer
    Abhitesh Kumar ─────────────────────────► Chief Growth Officer
    Sanu Kapoor ────────────────────────────► VP, General Counsel & CS
- Prabhat Agrawal (Promoter, MD & CEO): Leads overall corporate strategy, capital allocation, and inorganic expansion.
- Prem Sethi (Promoter, Director & COO): Oversees operational execution, supply chain logistics, and warehouse management.
- Balakrishnan Natesan Kaushik (Group CFO): Manages financial risk, capital structure, and treasury functions.
- Inorganic Growth Track Record: Entero has completed 51 strategic acquisitions since its inception. Notably, the company completed zero new acquisitions during Q1FY27, focusing instead on organic integration and extracting operational leverage from past additions.
Investment Thesis: Opportunities vs. Strategic Risks
Evaluating Entero Healthcare from an investment perspective requires balancing its strong operational growth against industry-specific structural risks.
                   INVESTMENT EVALUATION MATRIX

    OPPORTUNITIES                             RISKS
  ┌─────────────────────────────────┐       ┌─────────────────────────────────┐
  │ • Pan-India distribution scale  │       │ • Working capital requirements  │
  │ • ROCE expansion to 21.1%       │  vs   │ • Integration of 51 M&A entities│
  │ • High-margin MedTech growth    │       │ • Pricing regulations (NLEM)    │
  │ • Operational leverage gains    │       │ • Low net margins (2.7% PAT)    │
  └─────────────────────────────────┘       └─────────────────────────────────┘
Potential Growth Drivers
- Supply Chain Consolidation: India’s pharmaceutical distribution sector remains highly fragmented. Entero’s institutional scale gives it an advantage in securing direct contracts with global and domestic pharmaceutical manufacturers.
- Margin Expansion Trajectory: As higher-margin business lines like MedTech scale toward the ₹1,000 Crore milestone, blended EBITDA margins could see upward support beyond current 5.0% levels.
- Capital Utilization: Reaching a 21.1% ROCE demonstrates that past acquisitions are turning productive, generating cash flows without requiring immediate dilutive equity raises.
Key Investment Risks
- Thin Net Margin Profiles: While growing, a PAT margin of 2.7% leaves limited cushion against unexpected cost increases, freight inflation, or supply chain disruptions.
- Regulatory & Price Control Risks: Price controls enforced via the National List of Essential Medicines (NLEM) can limit gross distribution margins on core pharmaceutical SKUs.
- M&A Integration Complexity: Managing 51 acquired entities across diverse geographic regions presents lingering IT, cultural, and operational integration risks.
- Working Capital Intensity: Despite reducing the inventory cycle to 61 days, pharmaceutical distribution remains working-capital intensive[cite: 1]. Rapid top-line growth can consume significant operating cash flow to fund inventory receivables.
Outlook & Final Verdict
Entero Healthcare’s Q1FY27 performance shows operational execution, highlighted by 38.2% top-line growth, margin gains, and significant ROCE expansion[cite: 1]. The choice to halt new acquisitions during the quarter and focus on organic integrations contributed directly to cash efficiency and operating leverage.
Investors tracking Entero Healthcare should monitor the following key variables in upcoming quarters:
- Execution of the MedTech expansion strategy toward its ₹1,000 Crore target[cite: 1].
- Ability to sustain or improve net working capital days below 61 days[cite: 1].
- Stabilization of PAT margins above 3.0% as scale increases[cite: 1].
Frequently Asked Questions (FAQs)
What was Entero Healthcare’s revenue growth in Q1FY27?
Entero Healthcare reported revenue from operations of ₹1,940.5 Crore in Q1FY27, representing a 38.2% YoY growth (and 40.0% on a like-for-like basis) compared to ₹1,403.8 Crore in Q1FY26[cite: 1].
How much did Entero Healthcare’s margins expand in Q1FY27?
Gross margins expanded by 147 bps YoY to 11.4%[cite: 1], while EBITDA margins expanded by 143 bps YoY to 5.0%[cite: 1].
What is the current Return on Capital Employed (ROCE) for Entero Healthcare?
Entero Healthcare achieved an ROCE of 21.1% in Q1FY27, up significantly from 11.5% in Q1FY26[cite: 1].
Did Entero Healthcare acquire any new companies in Q1FY27?
No new acquisitions were completed in Q1FY27[cite: 1]. The total number of acquisitions completed since inception remains at 51 as the company prioritized organic integration[cite
Disclaimer: This article is for educational purposes only and not financial advice. Investors should do their own due diligence before investing.
Disclaimer: The projections of potential returns are based on current market conditions and company performance. Actual results may vary due to various factors, including market dynamics, economic conditions, and changes in the competitive landscape. Investors should conduct their own research and consult with financial advisors before making investment decisions.
Multibagger Stocks breakout stocks
⚠️ Not SEBI Registered—just here to share insights | 🚫 No paid services—everything shared is entirely free! 🧠 Always Learning and excited to grow together in this journey of market exploration.
📲 Join Our Investor Communities
🔹 Join our Telegram Channel: Multibagger Hunts
🔹 Join our WhatsApp Channel: Click to Join
✅ Free access
✅ Instant alerts
✅ Curated research for serious investors
TwitterXWhatsAppThreadsTelegramFacebookLinkedInGmailEmailShare