admin
admin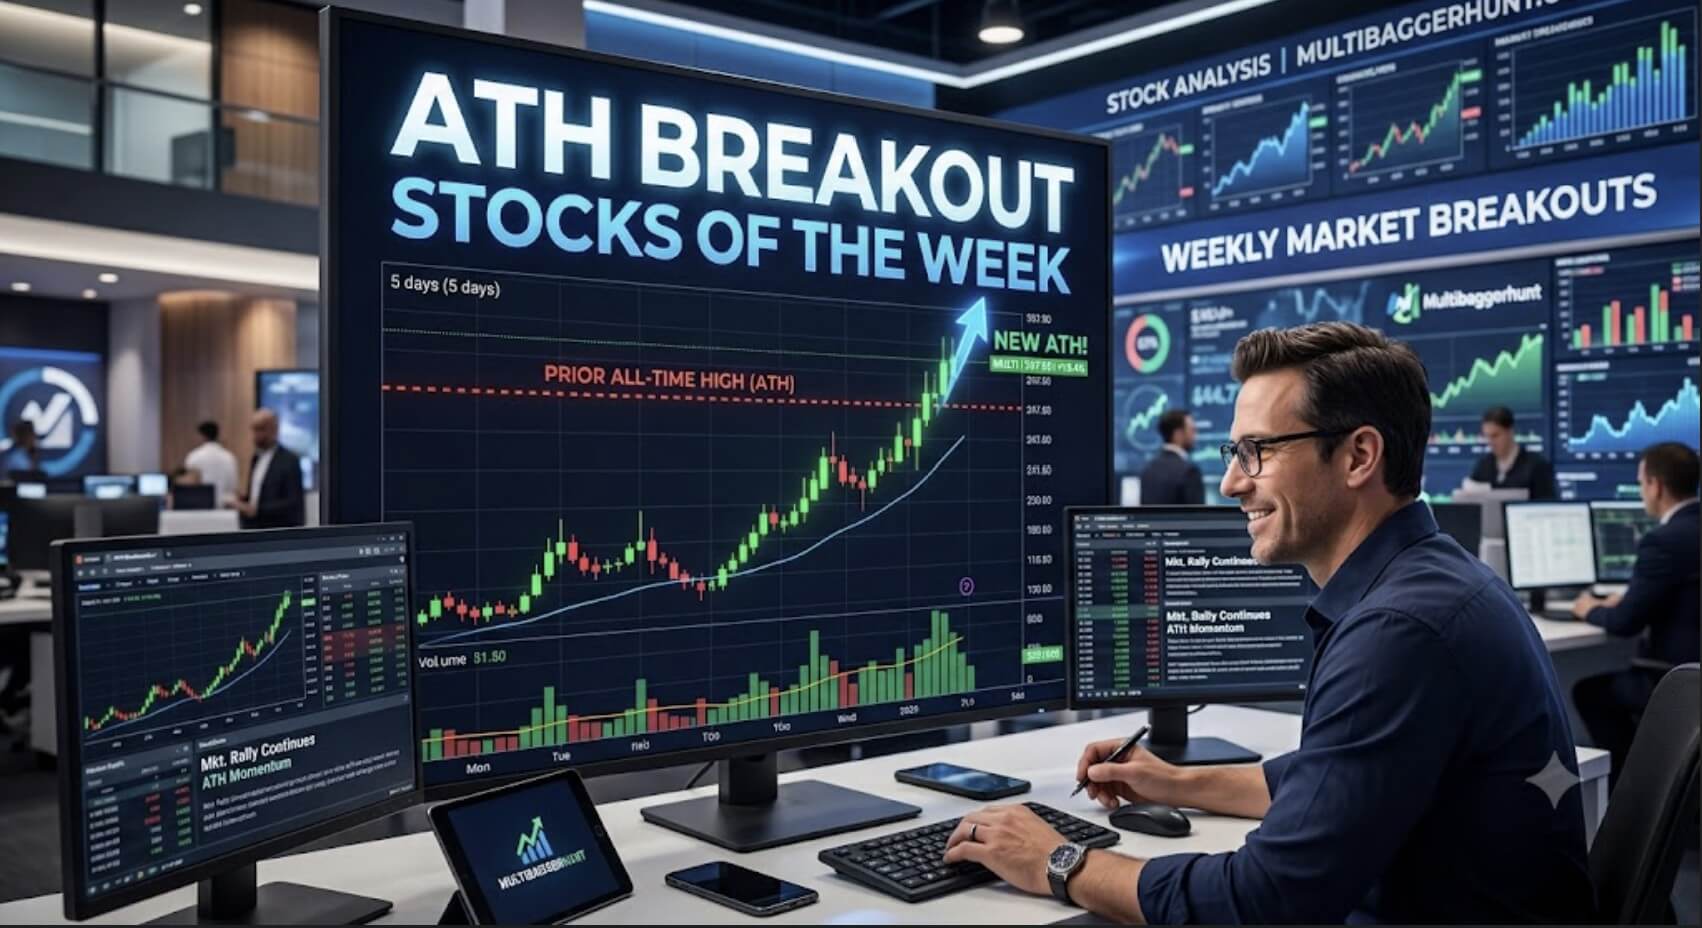
ATH Breakout Stocks of the Week: High-Growth Stocks Analysis
When a stock breaks out to an All-Time High (ATH), it signals that market buyers have absorbed all historical overhead supply. There are no remaining sellers trapped at higher price levels waiting to break even. This technical milestone often aligns with improving business fundamentals, expanding operational margins, market-share gains, or supportive macroeconomic trends.
Identifying ATH breakout stocks of the week offers investors and momentum traders an opportunity to discover strong performers supported by institutional capital inflows. However, buying stocks at all-time highs requires a systematic approach that balances technical price action with fundamental valuation, earnings quality, and risk management.
This guide provides an in-depth analysis of ten prominent Indian companies breaking out to or trading near all-time high price zones: Samvardhana Motherson International Ltd, Neuland Laboratories Ltd, Fiem Industries Ltd, Shriram Finance Ltd, Marine Electricals (India) Ltd, ASK Automotive Ltd, Pearl Global Industries Ltd, Filatex India Ltd, Redington Ltd, and Deep Industries Ltd.
To explore more about fundamental screening methods, read our internal guide on stock market momentum strategies and reference real-time exchange data directly from the National Stock Exchange of India (NSE).
Sector Benchmark & Fundamental Overview
Before analyzing each company individually, comparing key financial and valuation metrics across the group helps contextualize their momentum.
| Stock Name | Sector / Industry | Market Cap Category | P/E Ratio (TTM) | ROE (%) | Key Growth Catalyst |
| Samvardhana Motherson | Auto Components | Large Cap | ~32.5 | ~14.2% | Global automotive EV transition & M&A synergy |
| Neuland Laboratories | Pharmaceuticals / API | Mid Cap | ~59.0 | ~21.5% | Specialty CMS/GDS scaling & high-margin APIs |
| Fiem Industries | Auto Lighting | Small/Mid Cap | ~26.8 | ~22.6% | Dominant 2W LED lighting market share |
| Shriram Finance | NBFC / Financials | Large Cap | ~23.7 | ~16.4% | Synergistic AUM growth in commercial vehicles |
| Marine Electricals | Defence & Marine | Small Cap | ~85.2 | ~13.7% | Navy order pipeline & green energy tech |
| ASK Automotive | Auto Ancillary | Mid Cap | ~42.2 | ~20.5% | Advanced braking systems & lightweighting |
| Pearl Global Industries | Textile & Apparel | Mid Cap | ~33.7 | ~19.0% | Global multi-country manufacturing leverage |
| Filatex India | Textiles / Synthetic | Small Cap | ~18.5 | ~12.8% | Poly-recycling expansion & raw material recovery |
| Redington Ltd | IT Distribution | Mid Cap | ~16.1 | ~19.3% | Enterprise cloud scaling & hardware demand |
| Deep Industries | Oil & Gas Services | Small Cap | ~19.8 | ~19.4% | Compression services & ONGC contract wins |
Detailed Analysis of the Top 10 ATH Breakout Stocks
1. Samvardhana Motherson International Ltd
Business Profile & Market Position
Samvardhana Motherson International Limited (SAMIL) is one of the world’s largest automotive component manufacturers. The company operates a globally diversified footprint spanning wiring harnesses, rear-view vision systems, interior and exterior polymer modules, and precision structural components.
Global Auto Component Demand ──► Wiring Harnesses & Polymers ──► Margin Expansion via M&A
Revenue & Earnings Analysis
SAMIL’s multi-tier global acquisition strategy has driven structural scale.
- Revenue Drivers: Premiumization in passenger vehicles, higher content per vehicle in electric vehicles (EVs), and integration of acquired entities (such as SAS Autosystemtechnik).
- Profitability: EBITDA margins benefit from operational efficiencies and stabilizing global freight and raw material costs.
- Balance Sheet Health: Net debt-to-EBITDA remains managed despite continuous capital expenditure for global expansion.
Technical Breakout & Investor Outlook
The stock’s rally past long-term resistance consolidates a multi-year cup-and-handle pattern. Institutional accumulation remains evident on high-volume breakout days.
- Key Strengths: Unmatched tier-1 OEM relationships, rising EV content per vehicle, and global manufacturing scale.
- Primary Risks: Slowdown in European automotive production, integration risks from rapid M&A, and currency fluctuation.
2. Neuland Laboratories Ltd
Business Profile & Market Position
Neuland Laboratories is a pharmaceutical business focused on Active Pharmaceutical Ingredients (APIs) and Custom Manufacturing Solutions (CMS). The company operates advanced US-FDA approved manufacturing facilities catering to global innovator pharma companies.
Complex APIs (GDS) ──► Custom Manufacturing (CMS) ──► High-Margin Revenue Shift
Revenue & Earnings Analysis
Neuland’s financial performance highlights a strategic pivot toward high-margin custom synthesis work.
- Revenue Metrics: Net sales crossed record quarterly thresholds, driven by its high-margin Custom Manufacturing Solutions segment.
- Profitability & Margins: Operating profit margins have expanded beyond historical levels due to a favorable product mix. TTM Return on Equity (ROE) stands near ~21.5%.
- Valuation: Trading at a trailing P/E of ~59x, reflecting the premium the market awards to specialized contract research and manufacturing (CRAMS) businesses.
Technical Breakout & Investor Outlook
Neuland’s breakout to fresh all-time highs follows a sharp multi-month consolidation base. Moving Average Convergence Divergence (MACD) and Relative Strength Index (RSI) indicate robust momentum on weekly timeframes.
- Key Strengths: Strong pipeline of commercial molecules in CMS, low debt-to-equity ratio (~0.11), and high regulatory compliance standard.
- Primary Risks: Revenue lumpiness in contract manufacturing quarters, raw material volatility, and US FDA inspection risks.
3. Fiem Industries Ltd
Business Profile & Market Position
Fiem Industries is a leading manufacturer of automotive lighting, signaling equipment, and rear-view mirrors in India. It maintains a dominant market share in the two-wheeler (2W) segment, serving major OEMs like TVS Motor, Honda Motorcycle & Scooter India (HMSI), and Yamaha.
Halogen Lighting ──► LED Conversion ──► Higher Realization Per Unit
Revenue & Earnings Analysis
Fiem’s core catalyst is the industry-wide transition from conventional halogen lamps to LED lighting assemblies.
- Revenue Growth: Annual revenues continue upward momentum, supported by higher content per vehicle in premium 2Ws and Electric 2Ws (EVs).
- Margin Execution: Operating margins remain healthy near 14–15%, enabled by automated manufacturing and local sourcing.
- Balance Sheet Strength: Virtually zero long-term debt with high return metrics (ROCE ~30.5%, ROE ~22.6%).
Technical Breakout & Investor Outlook
Fiem Industries broke out above its consolidation resistance zone on substantial volume. The stock is demonstrating steady price action supported by the 20-day and 50-day Exponential Moving Averages (EMA).
- Key Strengths: First-mover advantage in 2W LED lighting, long-standing OEM relationships, debt-free balance sheet.
- Primary Risks: High client concentration in the two-wheeler market and cyclical fluctuations in domestic auto sales.
4. Shriram Finance Ltd
Business Profile & Market Position
Shriram Finance is the flagship company of the Shriram Group and one of India’s largest retail asset-financing Non-Banking Financial Companies (NBFCs). The company holds a market position in pre-owned commercial vehicle (CV) financing, passenger vehicles, micro-SME loans, and gold loans.
Pre-Owned CV Financing ──► Cross-Selling Micro-SME/Gold Loans ──► Yield Optimization
Revenue & Earnings Analysis
The post-merger integration of Shriram Transport Finance and Shriram City Union Finance continues to unlock revenue synergies.
- Net Interest Income (NII): Total income grew consistently quarter-on-quarter, driven by demand in rural and semi-urban commercial vehicle logistics.
- Asset Quality: Gross Non-Performing Assets (GNPAs) have shown steady improvement, while Provision Coverage Ratios (PCR) remain conservative.
- Return Metrics: Delivers an ROE of ~16.4% and net profit margins exceeding ~25%.
Technical Breakout & Investor Outlook
Shriram Finance’s breakout past its historical peak highlights institutional momentum across NBFCs. FII and DII holdings remain high, supporting price stability.
- Key Strengths: Deep semi-urban distribution network, cross-selling capabilities, and strong pricing power in used-vehicle loans.
- Primary Risks: Higher cost of funds in elevated interest rate environments and credit risks associated with lower-income borrower segments.
5. Marine Electricals (India) Ltd
Business Profile & Market Position
Marine Electricals provides integrated electrical, automation, and communication solutions for marine and industrial applications. The company is a key supplier to the Indian Navy, Coast Guard, commercial shipbuilders, and industrial data centers.
Naval Defence Capital Outlay ──► Custom Electrical Switchboards ──► Execution Scale
Revenue & Earnings Analysis
Driven by India’s “Make in India” defence initiative, Marine Electricals has expanded its order backlog.
- Top-Line Acceleration: Revenue growth has accelerated due to faster execution of naval vessel electrification projects.
- Margin Dynamics: Gross margins benefit from customized, high-specification engineering solutions.
- Valuation Note: With a P/E ratio above ~85x, the market is pricing in sustained order wins and execution scale.
Technical Breakout & Investor Outlook
The stock’s technical breakout accompanied an increase in daily trading volumes, breaching key weekly resistance levels.
- Key Strengths: High entry barriers in naval defence certification, growing data center electrical order pipeline.
- Primary Risks: Rich valuation multiple leaving low margin for error, contract delay risks, and working capital intensity.
6. ASK Automotive Ltd
Business Profile & Market Position
ASK Automotive is an auto-component manufacturer specializing in Advanced Braking Systems (ABS), aluminum lightweighting precision solutions, and safety control cables in India.
Traditional Braking ──► Aluminum Lightweighting ──► Premium EV/ICE Content
Revenue & Earnings Analysis
ASK Automotive benefits from strict safety regulations and vehicle lightweighting trends.
- Financial Growth: Revenues have trended upwards, driven by supply contracts with top two-wheeler OEMs.
- Operating Efficiency: Maintains strong return on capital employed (ROCE) and comfortable leverage metrics.
- Valuation: Trades at a P/E ratio of ~42x, reflecting steady earnings visibility.
Technical Breakout & Investor Outlook
Since its recent listing, ASK Automotive has formed higher-high and higher-low structures, recently breaking out of a multi-week consolidation base.
- Key Strengths: High market share in 2W brake shoes, growing share of content per EV, robust operational execution.
- Primary Risks: Fluctuation in raw material prices (aluminum) and dependence on the two-wheeler sector.
7. Pearl Global Industries Ltd
Business Profile & Market Position
Pearl Global Industries is a multinational apparel manufacturer that designs, manufactures, and distributes garments to global fashion brands across North America, Europe, and Asia.
Multi-Country Manufacturing Base ──► Supply Chain Diversification ──► Global Retailer Contracts
Revenue & Earnings Analysis
The company utilizes a multi-country manufacturing setup (India, Bangladesh, Vietnam, Indonesia, Guatemala) to offer supply-chain flexibility to global apparel buyers.
- Revenue Metrics: Annual sales expanded steadily, supported by wallet-share gains among major US/European retailers.
- Margin Profile: Operating margins expanded due to higher-value product offerings and asset-light geographic diversification.
- Return Profile: Delivers an ROE near ~19%.
Technical Breakout & Investor Outlook
The stock has cleared major technical chart levels on above-average volume, signaling strong relative strength compared to broader textile sector benchmarks.
- Key Strengths: Strategic multi-country manufacturing, key global customer base, strong return metrics.
- Primary Risks: Consumer slowdown in US and European retail markets, foreign exchange risks, and regional labor cost inflation.
8. Filatex India Ltd
Business Profile & Market Position
Filatex India manufactures synthetic yarn, including Polyester Filament Yarn (POY), Fully Drawn Yarn (FDY), and Drawn Textured Yarn (DTY).
Polyester Polymerisation ──► Value-Added Yarns ──► Recycled PET Initiative
Revenue & Earnings Analysis
Filatex focuses on expanding its value-added yarn portfolio and establishing polyester recycling initiatives.
- Top-Line Dynamics: Top-line growth correlates with industrial textile demand and raw material price stability (PTA and MEG).
- Operating Profitability: EBITDA per ton metrics have improved due to better capacity utilization and product mix optimization.
- Valuation Context: With a trailing P/E of ~18.5x, it remains reasonably valued compared to historical mid-cap textile multiples.
Technical Breakout & Investor Outlook
Filatex completed a long-term base breakout pattern, supported by rising daily and weekly transaction volumes.
- Key Strengths: Backward integration in polymerization, growing focus on sustainable recycled polyester, comfortable debt metrics.
- Primary Risks: Crude oil price volatility affecting raw material inputs and dumping risks from international polyester producers.
9. Redington Ltd
Business Profile & Market Position
Redington Limited is a major technology distributor and supply chain solution provider across India, the Middle East, Africa, and South Asian markets. It distributes products for brands like Apple, Microsoft, HP, Google, and Cisco.
IT Hardware Distribution ──► Enterprise Cloud & Software Services ──► High Asset Turnover
Revenue & Earnings Analysis
Redington operates a high-volume, asset-light distribution model with elevated asset turnover ratios.
- Revenue Scale: Consolidated annual revenues exceeded ₹63,800 crore, reflecting steady enterprise IT and consumer device demand.
- Efficiency & Returns: Despite modest EBITDA margins (~2.3%), Redington maintains strong Return on Equity (ROE ~19–25%) through rapid working capital cycles.
- Valuation: Trades at an attractive P/E multiple (~16.1x), offering value along with momentum.
Technical Breakout & Investor Outlook
Redington stock broke through multi-year overhead resistance, driven by institutional interest and healthy earnings announcements.
- Key Strengths: Extensive distribution network, key technology vendor partnerships, high return on equity, and consistent dividend history.
- Primary Risks: Working capital risks, thin operating margins vulnerable to foreign exchange fluctuations, and consumer spending slowdowns.
10. Deep Industries Ltd
Business Profile & Market Position
Deep Industries provides specialized oil and gas field services in India. Its service portfolio includes natural gas compression, natural gas processing, workover operations, and drilling services.
Gas Compression Services ──► Long-Term ONGC/Oil India Contracts ──► High Cash Flow Predictability
Revenue & Earnings Analysis
Deep Industries benefits from increased domestic exploration and production (E&P) capex by major state-owned and private energy companies.
- Revenue Growth: Annual revenues grew, driven by contract wins from ONGC and other national oil companies.
- Margin Performance: Operating profit margins remain high (~35–40%) due to the capital-intensive nature of specialized compression equipment.
- Capital Efficiency: Low debt-to-equity ratio (~0.10) with an ROE near ~19.4%.
Technical Breakout & Investor Outlook
The stock cleared its all-time high price barrier on above-average trading volume, following sustained contract accumulation.
- Key Strengths: Strong market position in gas compression, multi-year order visibility, healthy balance sheet.
- Primary Risks: Order delay risks from state-owned E&P majors and capital expenditure requirements for equipment upgrades.
Technical Breakout Indicators & Chart Patterns
Analyzing ATH breakout stocks requires evaluating key technical parameters to distinguish genuine momentum from false breakouts:
- Volume Confirmation: A breakout should be accompanied by trading volume at least 1.5x to 2x higher than the 20-day average volume to verify institutional participation.
- Support & Resistance Levels: Former resistance levels should act as initial support during subsequent price pullbacks.
- Relative Strength Index (RSI): An RSI between 65 and 75 confirms strong bullish momentum without necessarily indicating an overbought condition.
- Moving Average Alignment: Price action should trade above the 20-day, 50-day, and 200-day Simple Moving Averages (SMA), with shorter-term averages stacked above long-term averages.
For additional market technical resources, review real-time price feeds on BSE India.
Risk Management & Position Sizing Framework
Buying stocks at all-time highs exposes investors to pullback risks if broader market indices undergo a correction. Implementing a risk management strategy helps safeguard capital:
Position Sizing (1-2% Portfolio Risk) ──► Trailing Stop Losses ──► Tranche-Based Profit Realization
- Staggered Entry (Pyramiding): Initiate a partial position (e.g., 50%) on the initial breakout, adding the remainder upon a successful retest of the breakout support zone.
- Trailing Stop Loss Placement: Set stop-loss levels just below the breakout structure or the 20-day EMA to limit downside exposure to 5–8% per trade.
- Valuation Sensitivity Check: Exercise caution when high-P/E breakout stocks display slowing quarter-on-quarter earnings growth.
- Portfolio Diversification: Avoid over-concentrating in a single sector (such as Auto Components or Financials) across breakout positions.
Conclusion & Strategic Takeaways
The top 10 ATH breakout stocks of the week—Samvardhana Motherson, Neuland Laboratories, Fiem Industries, Shriram Finance, Marine Electricals, ASK Automotive, Pearl Global Industries, Filatex India, Redington, and Deep Industries—represent a blend of fundamental growth and market momentum.
Investors should evaluate earnings sustainability, debt levels, and valuation multiples alongside price action. Combining technical breakout entry points with structured stop losses allows market participants to capitalize on momentum while managing downside risks.
Disclaimer: This article is strictly for informational and educational purposes only and does not constitute financial or investment advice. Stock investments are subject to market risks. Conduct your own research or consult a certified financial advisor before making investment decisions.
Disclaimer: This article is for educational purposes only and not financial advice. Investors should do their own due diligence before investing.
Loans
Disclaimer: The projections of potential returns are based on current market conditions and company performance. Actual results may vary due to various factors, including market dynamics, economic conditions, and changes in the competitive landscape. Investors should conduct their own research and consult with financial advisors before making investment decisions.
Multibagger Stocks breakout stocks
⚠️ Not SEBI Registered—just here to share insights | 🚫 No paid services—everything shared is entirely free! 🧠 Always Learning and excited to grow together in this journey of market exploration.
📲 Join Our Investor Communities
🔹 Join our Telegram Channel: Multibagger Hunts
🔹 Join our WhatsApp Channel: Click to Join
✅ Free access
✅ Instant alerts
✅ Curated research for serious investors
Finance
TwitterXWhatsAppThreadsTelegramFacebookLinkedInGmailEmailShare