admin
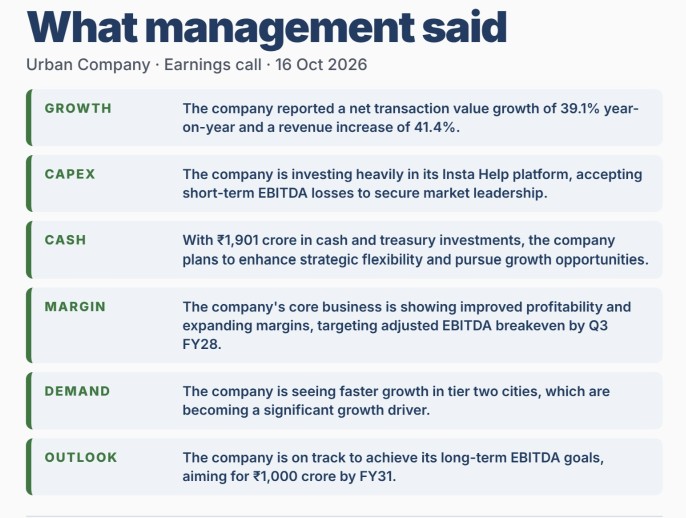
he Urban Company Q2 FY27 earnings call took place on October 16, 2026. During this meeting, leadership discussed the company’s operating and financial performance for the second quarter of fiscal year 2027. Chief Executive Officer Abhiraj Singh Bhal and Chief Financial Officer Abhay Mathur guided the discussion.
Overall, the quarter revealed an intentional two-part business plan. First, the mature core services business delivered rapidly expanding profit margins. Second, the company directed substantial capital into its quick-service bet, InstaHelp. In addition, the board approved a major capital raise of up to ₹2,500 crore. As a result, the business has reinforced its long-term path toward sustainable market leadership.
This detailed analysis breaks down the financial metrics, unit economics, segment performance, and strategic outlook presented during the call.
Key Highlights from the Urban Company Q2 FY27 Earnings Call
Urban Company recorded strong operational momentum across all primary metrics during the quarter. Furthermore, top-line growth remained near 40% year-on-year for the third consecutive quarter.
The primary consolidated figures include:
- Net Transaction Value (NTV): Consolidated NTV increased 39% year-on-year to ₹1,432 crore.
- Revenue from Operations: Revenue rose 41.4% year-on-year to reach ₹537.3 crore.
- Total Delivered Orders: Completed orders reached 15.1 million, which is an increase of 103% year-on-year.
- Annual Transacting Users: Active annual users grew by 35% to reach nearly 10 million customers.
- Core Business Adjusted EBITDA: Profit for the core business (excluding InstaHelp) surged 213% year-on-year to ₹30 crore.
- Consolidated Adjusted EBITDA: Consolidated EBITDA showed a net loss of ₹144 crore due to a deliberate ₹174 crore investment in InstaHelp.
- Consolidated Net Loss: Total net loss widened to ₹182.5 crore, compared to ₹59 crore in the prior-year quarter.
- Cash and Liquid Reserves: Total cash balances and treasury investments stood at ₹1,901 crore at the end of the quarter.
Therefore, these numbers highlight two distinct trends. The core marketplace is generating healthy operating cash flow. Meanwhile, newer service bets are consuming capital to build market share and customer density.
Consolidated Financial Performance Breakdown
Revenue growth outpaced NTV growth during the quarter. Specifically, revenue grew by 41.4%, while NTV expanded by 39.0%. This positive spread occurred because take rates improved across mature service lines. In addition, sales of private-label consumer appliances contributed higher direct revenue.
The following table summarizes the key financial data:
| Metric | Q2 FY26 | Q2 FY27 | YoY Change (%) | Primary Strategic Driver |
| Net Transaction Value (NTV) | ₹1,030.2 Cr | ₹1,432.0 Cr | +39.0% | Accelerated order volume and city density |
| Revenue from Operations | ₹380.0 Cr | ₹537.3 Cr | +41.4% | Favorable category mix and higher take rates |
| Total Orders Delivered | 7.44 M | 15.10 M | +103.0% | Strong adoption of low-ticket InstaHelp tasks |
| Annual Transacting Users | 7.40 M | ~10.00 M | +35.1% | Higher penetration across Tier-1 and Tier-2 hubs |
| Core Adjusted EBITDA (ex-InstaHelp) | ₹9.6 Cr | ₹30.0 Cr | +212.5% | Operating leverage across fixed overhead |
| Consolidated Adjusted EBITDA | -₹21.4 Cr | -₹144.0 Cr | N/A (Loss widened) | Intentional ₹174 Cr investment in InstaHelp |
| Consolidated Net Loss | -₹59.0 Cr | -₹182.5 Cr | N/A (Loss widened) | Higher depreciation and platform scaling costs |
| Cash and Liquid Assets | ₹1,650.0 Cr | ₹1,901.0 Cr | +15.2% | Strong balance sheet ahead of capital raise |
Consequently, these metrics demonstrate that customer demand remains steady across categories. In fact, total orders more than doubled over the past twelve months.
However, average user spending grew at a modest 3% rate, compared to historical rates of 6% to 7%. Management clarified that this shift was expected. First, lower-ticket InstaHelp orders naturally diluted overall order sizes. Second, a later festive calendar shifted heavy home-cleaning jobs into the third quarter. For more insights on platform order dynamics, read our guide on Indian marketplace economics and unit margins.
Segment Growth in the Urban Company Q2 FY27 Earnings Call
Management divides the company’s operating footprint into four primary vectors. Each segment displays unique financial and operating dynamics.
          CONSOLIDATED NTV CONTRIBUTION (Q2 FY27)
  ┌─────────────────────────────────────────────────────────┐
  │  ■ India Core Services (58%)   ■ InstaHelp (24%)        │
  │  ■ Native Products (11%)       ■ International (7%)     │
  └─────────────────────────────────────────────────────────┘
India Consumer Services (Core Platform)
The domestic core platform consists of home repairs, beauty, cleaning, and appliance servicing. It remains the cash-generating foundation of the business:
- NTV Growth: The core business grew 26% year-on-year.
- Margin Expansion: Adjusted EBITDA margin expanded by 110 basis points to 3.5% of NTV.
- Trailing Profitability: The core business generated ₹119 crore in Adjusted EBITDA over the past three quarters. Thus, core profit rose 175% year-on-year.
- Tier-2 Market Traction: Tier-2 cities grew at 37% year-on-year. Consequently, these emerging cities now represent a reliable second growth engine.
Native Products (Direct-to-Consumer Hardware)
Native designs and sells smart water purifiers and digital door locks directly to consumers:
- NTV Growth: Native NTV rose 35% year-on-year.
- Profit Path: Operating loss margins narrowed by 220 basis points. Therefore, Native is nearing operational breakeven.
- New Product Categories: The board gave in-principle approval to develop residential smart air conditioners. However, the initial rollout will be measured and conducted directly via the mobile app.
International Operations
The international division serves markets in the United Arab Emirates, Singapore, Saudi Arabia, and the United States:
- NTV Growth: International NTV grew 66% year-on-year.
- Margin Performance: Operating margins expanded by 190 basis points to reach 2.0% of NTV.
- Key Regions: Growth was led by market-share gains in Dubai and Abu Dhabi. In those markets, higher average order values offset customer acquisition costs.
InstaHelp Investment Strategy: Detailed Economic Analysis
The most thoroughly analyzed topic during the Urban Company Q2 FY27 earnings call was InstaHelp. Management described InstaHelp as its most important strategic bet. As a result, the company is directing significant capital to scale this quick-service model.
           THE INSTAHELP DENSITY FLYWHEEL
  ┌─────────────────────────────────────────────────┐
  │ 1. Higher Micro-Market Order Volume             │
  │        │                                        │
  │        ▼                                        │
  │ 2. Shorter Transit Distances (< 1 km)          │
  │        │                                        │
  │        ▼                                        │
  │ 3. Lower Fulfillment Cost Per Task              │
  │        │                                        │
  │        ▼                                        │
  │ 4. Accessible Customer Pricing (₹200/hr)        │
  │        │                                        │
  │        ▼                                        │
  │ 5. Increased Daily Booking Frequency            │
  └─────────────────────────────────────────────────┘
Strategic Goal of InstaHelp
Historically, Urban Company focused on scheduled appointments with ticket sizes between ₹800 and ₹3,500. While these services deliver high profit margins, they have modest annual booking frequencies. In contrast, InstaHelp addresses low-ticket, high-frequency domestic chores. For instance, tasks include minor plumbing fixes, electrical repairs, and emergency domestic help delivered within 15 to 30 minutes.
Therefore, InstaHelp transforms the app from an occasional luxury into an everyday utility. Furthermore, this change increases user retention and raises lifetime customer value.
Operational Scale and Sequential Progress
InstaHelp delivered rapid volume growth during the quarter:
- Delivered Orders: Orders surged 63% sequentially, rising from 3.82 million in Q1 FY27 to 6.23 million in Q2 FY27.
- Unit Economics: Net loss per order improved by 19.4% sequentially, dropping from ₹346 in Q1 FY27 to ₹279 in Q2 FY27.
- Adjusted EBITDA Impact: The division posted an Adjusted EBITDA loss of ₹174 crore for the quarter.
Consequently, the loss widened in absolute terms because order volumes expanded so rapidly across 18 major cities.
Unit Economics Waterfall
To understand the path to profitability, consider the per-order unit cost breakdown for InstaHelp:
  INSTAHELP ESTIMATED PER-ORDER WATERFALL (Q2 FY27)
  Gross Consumer Price:               ₹ 185
  Less: Service Partner Payout:      (₹ 245)
  -----------------------------------------
  Direct Service Margin:             (₹  60)
  Customer Acquisition & Promos:     (₹ 110)
  App Infrastructure & Support:      (₹  65)
  Partner Onboarding & Equipment:    (₹  44)
  -----------------------------------------
  Net Realized Loss Per Order:       (₹ 279)
Management plans to improve these unit economics systematically over the next four years.
| Target Variable | Q2 FY27 Level | FY29 Projection | FY31 Long-Term Goal | Operational Improvement Levers |
| Service Fee / Price | ₹140 – ₹185 / hr | ₹175 – ₹190 / hr | ~₹200 / hr | Gradual reduction of promotional user discounts |
| Net Order Value (NOV) | ₹185 – ₹210 | ₹240 – ₹260 | ~₹300 | Cross-selling repair components and spare parts |
| Partner Travel Distance | 3.4 km | 1.8 km | < 1.0 km | Hyperlocal dispatch algorithms driven by density |
| Daily Jobs per Partner | 2.6 jobs / day | 4.5 jobs / day | 6.0 jobs / day | Faster technician transit between nearby tasks |
| Profit / Loss per Order | -₹279 | -₹45 | +₹25 to +₹35 | Elimination of subsidies and higher task density |
| Segment Adjusted EBITDA | -₹174 Cr / quarter | Near Breakeven | Sustained Profit | Full segment breakeven targeted for early FY31 |
The Role of Density in Lowering Costs
CEO Abhiraj Singh Bhal emphasized that instant home services depend on geographical density. For example, if a service professional travels four kilometers for a 20-minute job, transit costs consume the entire margin.
However, when order density rises within a single neighborhood, travel distances drop below one kilometer. As a result, the technician can walk or cycle between appointments. This shift allows the professional to complete six jobs per day instead of three.
Because of this dynamic, management is investing heavily to build network density early. In turn, dense networks create high competitive barriers. Prospective rivals would face severe partner churn if they tried to enter without matching that order volume.
To review official shareholder letters and investor presentations, consult the Urban Company Investor Relations Portal.
Supply Ecosystem and Partner Welfare
Service professionals represent the critical supply foundation of Urban Company’s marketplace. During the earnings call, management shared data from its semi-annual partner welfare report.
  MONTHLY SERVICE PARTNER IN-HAND EARNINGS (H1 FY27)
  ₹60,000 ┬─────────────────────────────────────────── ₹56,731
          │                                         (Top 5% Earners)
  ₹50,000 ┼
          │
  ₹40,000 ┼
          │
  ₹30,000 ┼─────────────────────── ₹30,708
          │                       (Overall Platform Average)
  ₹20,000 ┼
          │
  ₹10,000 ┼
          │
      ₹0  ┴───────────────────────────────────────────
Partner Earnings Overview
The data revealed healthy financial outcomes for service partners:
- Average In-Hand Pay: Active service professionals earned an average net income of ₹30,708 per month during H1 FY27. This represents a 10.2% increase year-on-year.
- Top Performers: The top 5% of skilled partners earned an average of ₹56,731 per month. Consequently, platform earnings remain competitive with formal clerical positions.
- Partner Retention: Twelve-month partner retention across core categories reached 84%. As a result, onboarding costs remained stable.
Technology and Quality Control
In addition to fair earnings, technology tools help maintain consistent quality across millions of orders:
- AI-Assisted Diagnostics: Technicians use computer-vision diagnostic tools in their partner application. These tools inspect broken appliances and standardize repair quotes.
- Automated Quality Checks: Algorithms evaluate post-service images to confirm that technicians followed proper operating procedures.
- Integrated Spare Parts: The company sources 82% of repair parts through its central supply chain. Therefore, customers receive genuine components at fair prices.
Balance Sheet Strength and the ₹2,500 Crore Capital Raise
A major strategic topic in the Urban Company Q2 FY27 earnings call was the board’s approval to raise up to ₹2,500 crore in fresh capital.
         PLANNED CAPITAL ALLOCATION FRAMEWORK
  ┌────────────────────────────────────────────────────────┐
  │ [████████████████████] Strategic Acquisitions (40%)    │
  │ [███████████████     ] InstaHelp Scaling (30%)         │
  │ [██████████          ] Native Hardware Rollout (20%)   │
  │ [█████               ] Core Platform Reserve (10%)     │
  └────────────────────────────────────────────────────────┘
Liquidity and Cash Reserves
Urban Company closed Q2 FY27 with ₹1,901 crore in cash and liquid treasury investments. Meanwhile, the company operates with an annualized burn rate of approximately ₹550 crore. Therefore, the existing balance sheet provides more than three years of operating cash runway without additional funding.
Rationale for the Capital Raise
Management explained that the ₹2,500 crore raise provides long-term flexibility rather than short-term cash support:
- InstaHelp War Chest: The capital protects the company against aggressive spending from quick-commerce competitors.
- Selective Acquisitions: The company intends to evaluate selective bolt-on acquisitions. These deals will target regional home-service startups and specialized appliance maintenance providers.
- Hardware Expansion: Expanding the Native hardware catalog requires working capital for inventory, manufacturing tools, and warranty reserves.
For an evaluation of tech platform balance sheets, read our analysis on long-term consumer marketplace investments.
Competitive Moats and Industry Landscape
Online home services in India remain less than 1% penetrated. As a result, the industry offers a multi-decade growth runway. Urban Company maintains distinct operational advantages over both traditional tradespeople and specialized startups.
  COMPETITIVE LANDSCAPE COMPARISON
┌─────────────────────────┬──────────────────────────┬────────────────────────┐
│ UNORGANIZED WORKERS     │ NICHE VERTICAL APPS      │ URBAN COMPANY          │
├─────────────────────────┼──────────────────────────┼────────────────────────┤
│ • Unpredictable fees    │ • Single service focus   │ • Multi-category scale │
│ • No verified training  │ • High marketing cost    │ • Shared customer base │
│ • No warranty coverage  │ • Fragile balance sheets │ • Strict quality checks│
│ • Highly localized      │ • Low repeat frequency   │ • Proprietary hardware │
└─────────────────────────┴──────────────────────────┴────────────────────────┘
Advantages Over Offline Workers
Unorganized tradespeople handle the vast majority of Indian home repairs. However, Urban Company provides distinct benefits:
- Verified Safety: Every professional completes mandatory background checks and skill certifications before onboarding.
- Standard Pricing: Transparent menu pricing prevents arbitrary fee negotiations inside customer homes.
- Insurance Coverage: Urban Company offers service warranties and property damage coverage up to ₹25,000 per job.
Advantages Over Vertical Startups
Niche platforms often struggle to achieve sustainable unit economics. In contrast, Urban Company leverages its multi-category model:
- Cross-Category Acquisition: A customer acquired through appliance repairs frequently books home salon appointments or cleaning services later. Consequently, customer acquisition costs are amortized across several business lines.
- Flexible Partner Allocation: Service partners can transition across related tasks during seasonal shifts. For example, AC repair technicians handle general appliance repairs during winter months.
Long-Term Outlook and Valuation Implications
Management reiterated its long-term financial guidance during the call. These financial targets highlight the path toward consolidated profitability:
       PATH TO ADJUSTED EBITDA BREAKEVEN
  ┌────────────────────────────────────────────────────────┐
  │ Q2 FY27 (Current):  Core profits offset part of bet    │
  │ Q3 FY28 (Target):   Consolidated EBITDA Breakeven      │
  │ FY31 (Target):      ₹1,000 Crore Consolidated EBITDA   │
  └────────────────────────────────────────────────────────┘
- Near-Term Guidance: Management expects combined Q2 and Q3 revenue to grow between 50% and 55% year-on-year.
- Consolidated Breakeven: The company plans to reach consolidated Adjusted EBITDA breakeven by Q3 FY28. At that point, core business profits should fully offset InstaHelp investments.
- Long-Term Profit Target: The enterprise is targeting ₹1,000 crore in consolidated Adjusted EBITDA by FY31.
Sum-of-the-Parts Valuation Framework
Investors should evaluate Urban Company through two distinct components:
- The Core Cash Engine: India Core Services, Native, and International operations generate reliable operational earnings. These units should be valued using steady-state EBITDA multiples appropriate for profitable consumer internet leaders.
- The InstaHelp Growth Option: InstaHelp represents a high-growth platform bet. Therefore, it should be valued on forward gross transaction volume, adjusted for near-term capital burn.
If InstaHelp achieves its target of positive unit margins by FY31, it will add a second high-margin cash engine to the enterprise. For additional financial modeling frameworks, review our platform unit economics and valuation guide.
Strategic Risks Highlighted in the Urban Company Q2 FY27 Earnings Call
Despite strong top-line growth, market participants must monitor several operational risks:
  PRIMARY OPERATING RISKS
┌───────────────────┬────────────────────────────────────────────────────┐
│ RISK FACTOR       │ OPERATIONAL DETAILS                                │
├───────────────────┼────────────────────────────────────────────────────┤
│ InstaHelp Burn    │ High losses could persist if technician travel     │
│                   │ distances fail to drop below target levels.        │
├───────────────────┼────────────────────────────────────────────────────┤
│ Equity Dilution   │ The ₹2,500 Cr capital raise could dilute existing  │
│                   │ shareholders if issued at a modest valuation.      │
├───────────────────┼────────────────────────────────────────────────────┤
│ Hardware Risk     │ Manufacturing smart air conditioners carries       │
│                   │ inventory, warranty, and seasonal supply risks.    │
├───────────────────┼────────────────────────────────────────────────────┤
│ Discretionary Lag │ Macroeconomic headwinds could slow consumer        │
│                   │ spending on discretionary home grooming services.  │
└───────────────────┴────────────────────────────────────────────────────┘
First, InstaHelp losses could remain elevated if competitive intensity increases. If competing platforms subsidize prices heavily, achieving local density will take longer and require more capital.
Second, launching smart air conditioners introduces complex supply-chain logistics. Hardware manufacturing involves seasonal inventory risk, component cost volatility, and warranty obligations that software platforms rarely face.
Third, issuing up to ₹2,500 crore in equity or convertible debt could dilute existing public shareholders. Investors should evaluate the pricing and conversion terms once formal proxy filings become available.
Finally, discretionary home grooming and deep cleaning remain sensitive to macro consumer sentiment. If urban white-collar wage growth slows, premium service booking frequency could decelerate.
Long-Term Perspective for Shareholders
The Urban Company Q2 FY27 earnings call revealed a business executing a disciplined two-speed operational strategy. Management is using the expanding cash flow of its established core marketplace to fund an ambitious expansion into instant micro-services.
Core businesses generated ₹30 crore of Adjusted EBITDA during the quarter, proving that mature service categories benefit from strong operating leverage. Meanwhile, InstaHelp delivered 6.23 million orders and reduced its sequential loss per order by 19%. Supported by ₹1,901 crore in liquid reserves and a proposed ₹2,500 crore capital raise, Urban Company maintains the balance-sheet strength required to build lasting local density.
Investors focused on long-term compound growth should track sequential loss-per-order trends in InstaHelp, core EBITDA margin expansion, and Tier-2 city adoption over upcoming quarters. These operational indicators will reveal whether the platform remains on schedule to achieve consolidated Adjusted EBITDA breakeven by Q3 FY28.
Disclaimer: This article is for educational purposes only and not financial advice. Investors should do their own due diligence before investing.
Start Investing
Disclaimer: The projections of potential returns are based on current market conditions and company performance. Actual results may vary due to various factors, including market dynamics, economic conditions, and changes in the competitive landscape. Investors should conduct their own research and consult with financial advisors before making investment decisions.
Multibagger Stocks breakout stocks
⚠️ Not SEBI Registered—just here to share insights | 🚫 No paid services—everything shared is entirely free! 🧠 Always Learning and excited to grow together in this journey of market exploration.
📲 Join Our Investor Communities
🔹 Join our Telegram Channel: Multibagger Hunts
🔹 Join our WhatsApp Channel: Click to Join
✅ Free access
✅ Instant alerts
✅ Curated research for serious investors
TwitterXWhatsAppThreadsTelegramFacebookLinkedInGmailEmailShare