admin
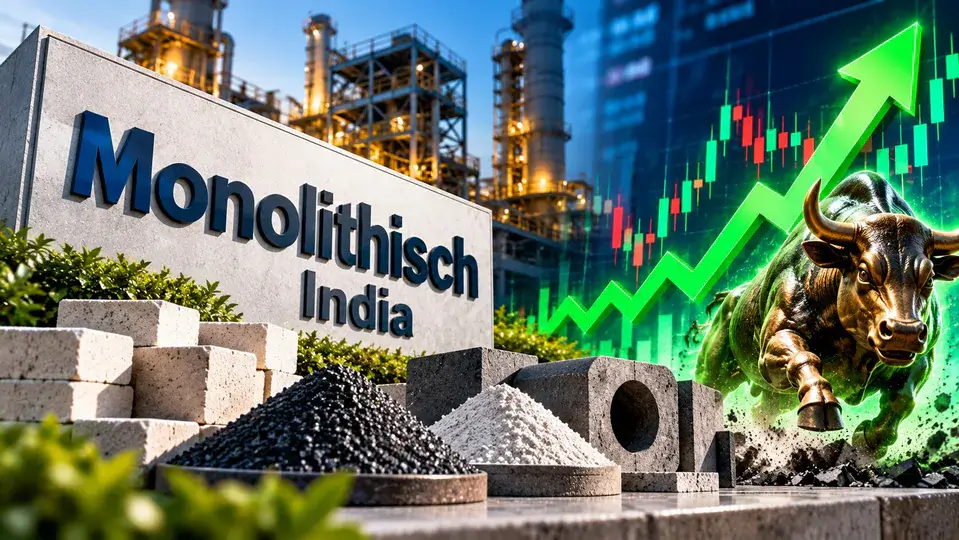
Monolithisch India Q2FY27 Business Update: Deep-Dive Financial Analysis, Premiumization Moat, and Execution Headwinds
Monolithisch India delivered strong financial results for the second quarter of FY27. Specifically, the Monolithisch India Q2FY27 business update reported an 88% year-on-year revenue increase and a 145% rise in profit after tax (PAT). These gains were driven by high demand for induction furnace refractories and broader customer adoption of its specialized pre-mixed silica ramming mass (SGB).
However, this rapid growth brings new operational challenges. The company is actively transitioning from a local mineral crusher into an integrated supplier with captive mining assets. As a result, investors need to examine both the strong headline growth and the underlying working capital demands.
Key Performance Metrics for Monolithisch India Q2FY27
During the quarter, the company expanded its sales mix and improved operating margins. The table below summarizes the key financial and operational figures reported in the update:
| Metric / Parameter | Q2FY27 Performance | Baseline / Target | Change / Status | Strategic Context |
| Topline Revenue | ₹53.6 Cr | ~₹28.5 Cr (Q2FY26) | +88.1% YoY | Trailed internal target of ₹55–60 Cr due to commissioning delays. |
| Profit After Tax (PAT) | ₹11.2 Cr | ~₹4.57 Cr (Q2FY26) | +145.1% YoY | Expansion supported by a larger share of premium SGB products. |
| H1 Cumulative PAT | ₹21.2 Cr | N/A | Strong Baseline | Run rate reflects annual net profits above ₹42 Cr. |
| SGB EBITDA Margin | 29.5% | Mid-teens historically | Margin Expansion | Driven by a ₹700–900/tonne price premium on SGB grades. |
| SGB Revenue Share | 61.0% | Below 40% (FY26) | Met Guidance | Landed within management’s targeted 60–65% band. |
| H1 Operating Cash Flow | ₹9.4 Cr | N/A | 44.3% of PAT | Cash conversion lagged due to higher working capital needs. |
| Annual Capacity | 5.76 Lakh MTPA | ~3.5 Lakh MTPA | Increased | Purulia plant started commercial production on October 10, 2026. |
| H2 Revenue Target | ₹149.0 Cr | H1: ₹101.0 Cr | +47.5% over H1 | Required to achieve the full-year target of ₹250 Cr. |
Business Model: Understanding Induction Furnace Refractories
To assess the company’s growth, it helps to understand how secondary steelmakers use silica ramming mass.
Secondary steel plants use electric induction furnaces to melt scrap metal and direct reduced iron at temperatures reaching 1,650°C. Because molten metal erodes furnace walls, operators line these vessels with silica ramming mass. This refractory barrier protects the water-cooled induction copper coils from extreme heat and liquid metal.
+-----------------------------------------------------------------------------------+
|                        RECURRENT REPLACEMENT CYCLE                                |
+-----------------------------------------------------------------------------------+
|  1. Quartzite Sourcing & Grading                                                  |
|         │                                                                         |
|         ▼                                                                         |
|  2. Pre-mixing with Boric Acid Binders                                            |
|         │                                                                         |
|         ▼                                                                         |
|  3. Installation as Induction Furnace Working Lining                              |
|         │                                                                         |
|         ▼                                                                         |
|  4. Lining Erosion (Requires relining every 20 to 50 heats)                       |
|         │                                                                         |
|         ▼                                                                         |
|  5. Mandatory Repeat Purchase of Ramming Mass                                     |
+-----------------------------------------------------------------------------------+
Because of extreme thermal and chemical wear, furnace linings must be stripped and replaced every 20 to 50 heats. Consequently, silica ramming mass functions as a non-discretionary consumable. Steel mills must continually repurchase refractory material to keep their furnaces operating.
For broader industry analysis, see our internal review of industrial manufacturing consumables and specialty materials.
Unit Economics of the Premium SGB Product Line
The main driver behind the company’s margin growth is its premium SGB line. In Q2FY27, SGB grades generated 61% of total revenue, meeting management’s 60–65% target.
   CONVENTIONAL MASS vs. PREMIUM SGB GRADE ECONOMICS
   (Estimated Per-Tonne Economics)

   [Conventional Mass]
   ├── Net Selling Price:         ₹4,500/tonne
   ├── Production Cost:           ₹3,800/tonne
   └── Gross Margin:              ₹700/tonne (15.5%)

   [Premium SGB Grade]
   ├── Net Selling Price:         ₹5,300/tonne  (+₹800/tonne premium)
   ├── Production Cost:           ₹4,050/tonne  (+₹250/tonne added cost)
   └── Gross Margin:              ₹1,250/tonne (23.6%)
        └── Net Margin Gain:     +₹550/tonne
Why Customers Pay More for SGB Grades
Steelmakers accept higher prices for SGB grades because they lower total operating costs. Specifically, the premium grade offers:
- Longer Lining Life: SGB Limited delivers 15% to 20% more heats per lining campaign compared to standard mixes.
- Lower Downtime: Relining a furnace takes 12 to 24 hours of non-productive downtime. Longer lining life means fewer relining cycles and higher steel output.
- Electricity Savings: A resilient lining minimizes heat loss to the water-cooled coils, which reduces power consumption per tonne of liquid steel.
Because these operational savings exceed the extra purchase price, Monolithisch India can maintain higher margins without losing customers to basic aggregate crushers.
Backward Integration: Sourcing from the Nawada Mine
Raw quartzite is the company’s largest single production expense. Historically, the company bought raw stone from open-market traders at ₹2,700 to ₹3,200 per tonne.
To secure raw material supply and lower input costs, the company acquired the Nawada mining block. Management expects this site to start commercial operations by mid-January 2027, subject to pending regulatory approvals.
RAW QUARTZITE LANDED COST BREAKDOWN (PER TONNE)

Market Purchase:   ################################### ₹2,700 - ₹3,200/Tonne
Captive Mine:      ################# ₹1,400 - ₹1,500/Tonne

Gross Cost Savings: ~₹1,200 - ₹1,800/Tonne
├── Passed to Customers:   ₹300 - ₹400/Tonne (Competitive Pricing)
└── Retained by Company:   ₹900 - ₹1,400/Tonne (Operating Margin Expansion)
By producing quartzite captively, landed stone costs are expected to fall to ₹1,400–1,500 per tonne. Management plans to pass ₹300–400 per tonne of these savings to steelmakers to protect market share, while retaining ₹900–1,400 per tonne to improve operating margins. Furthermore, contract mining keeps upfront machinery costs low, though working capital will still be needed for statutory deposits and royalty fees.
For more details on mining leases and environmental requirements, review the Ministry of Mines – Government of India Guidelines.
Manufacturing Capacity: Purulia, Karnataka, and Rajasthan
To support sales across India, Monolithisch India is expanding its production network closer to regional steel hubs.
ANNUAL PRODUCTION CAPACITY PIPELINE (LAKH MTPA)

Prior Capacity:        [=== 3.50 ===]
Purulia Facility:      [====== 2.26 ======]  --> Current Total: 5.76 Lakh MTPA
Planned Expansions:    [======== 3.00 ========] (Target: Late 2027)

Projected Mid-Term Total: 8.76 Lakh MTPA
1. Purulia Facility (West Bengal)
- Status: Commercial production began on October 10, 2026.
- Q2 Contribution: Because commissioning was delayed from late September, the plant generated no revenue in Q2, which caused the slight quarterly revenue miss.
- Location Benefits: The site provides direct rail and road access to secondary steel clusters in Durgapur, Asansol, and Jharkhand, while easing access to Haldia port for exports.
2. Greenfield Units in Karnataka and Rajasthan
- Planned Capacity: A combined 3.0 lakh tonnes annually across both facilities.
- Capital Outlay: Management has earmarked approximately ₹45 Cr for both units.
- Commissioning Dates: Targeted for July 2027 in Karnataka and November 2027 in Rajasthan.
- Freight Advantages: Because ramming mass is heavy, road transport over long distances quickly erodes margins. Placing plants in Karnataka and Rajasthan positions production near steelmakers in Bellary and northern industrial corridors, reducing delivery costs.
Balance Sheet Review: Cash Flow vs. Reported Profit
Although earnings expanded significantly, cash generation diverged from reported net profit during the first half of the year.
           H1 FY27 PROFITABILITY COMPARED TO CASH FLOW
                       (Values in ₹ Crore)

  Reported Net Profit (H1 PAT):   =========================> ₹21.2 Cr
  Operating Cash Flow (H1 CFO):   ==========> ₹9.4 Cr

  Working Capital Absorption:    ₹11.8 Cr
During H1 FY27, the business generated ₹21.2 Cr in net profit, but Operating Cash Flow (CFO) stood at ₹9.4 Cr. Consequently, the operating cash flow-to-PAT conversion rate was 44.3%.
This difference stemmed from higher working capital requirements:
- Building Inventory: Commissioning Purulia required stocking raw quartzite and finished bags to maintain order fulfillment.
- Receivables Growth: Revenue jumped 88% year-on-year, and supporting higher sales volumes in the secondary steel sector required extending credit terms.
- Mining Deposits: Opening the Nawada site required upfront statutory fees and advance operational prepayments.
As the company progresses through H2, reducing inventory and collecting receivables will be necessary to self-fund the ₹45 Cr expansion without adding excessive short-term debt.
For further discussion on evaluating corporate leverage, read our guide on analyzing balance sheet debt and working capital.
H2 FY27 Outlook: Evaluating the ₹250 Cr Revenue Target
Management has maintained its full-year FY27 revenue target of ₹250 Cr. However, reaching this figure will require a sharp acceleration in production and sales.
       FY27 FULL-YEAR REVENUE EXECUTION REQUIREMENT
                    (Values in ₹ Crore)

  H1 Actual Revenue:   ===================> ₹101.0 Cr
  H2 Target Revenue:   =============================> ₹149.0 Cr

  Target Total:        ₹250.0 Cr
The Required H2 Acceleration
- H1 Base: Revenue across Q1 and Q2 totaled ₹101.0 Cr.
- Implied H2 Target: The company needs ₹149.0 Cr in H2, representing a 47.5% increase over H1.
- Quarterly Run Rate: Average quarterly sales must step up from ₹50.5 Cr in H1 to ₹74.5 Cr across Q3 and Q4.
Meeting this guidance will depend directly on how fast the Purulia plant scales up and whether commercial mining at Nawada begins on schedule in mid-January 2027.
Operational and Market Risks to Monitor
Investors should weigh these growth catalysts against three main operating risks:
+-----------------------------------------------------------------------------------+
|                            KEY OPERATIONAL RISKS                                  |
+-----------------------------------------------------------------------------------+
|  1. Plant Ramp-Up Timelines   | New plants typically take 12 to 18 months to reach|
|                               | full capacity as mills test lining performance.   |
|  2. Statutory Clearances      | Commercial operations at Nawada rely on final     |
|                               | regulatory approvals without administrative delay.|
|  3. Working Capital Drag      | Divergence between cash flow and PAT could limit  |
|                               | self-funding for upcoming expansion projects.     |
+-----------------------------------------------------------------------------------+
- Slow Client Trials: Steel mills test furnace linings carefully because lining failures risk coil burnouts. Therefore, the Purulia facility may require several quarters of trial runs before local buyers transition to high-volume bulk orders.
- Mining Approval Delays: If statutory permits for the Nawada block face delays, the company will have to keep buying open-market quartzite, which would postpone expected raw material cost savings.
- Steel Industry Cycles: If secondary steel margins weaken due to high scrap costs or soft finished rebar pricing, mills often push for extended payment terms, adding further pressure on trade receivables.
Peer Comparison: Margins and Working Capital
To contextualize Monolithisch India’s operating performance, the table below compares its key metrics with typical domestic peers:
| Performance Metric | Monolithisch India (Q2FY27) | Tier-1 Refractory Peer | Mineral Processor Peer |
| YoY Revenue Growth | 88.1% | 12.4% | 18.2% |
| Operating Margin | ~24.5% (29.5% SGB) | 16.5% | 14.8% |
| Return on Equity (ROE) | ~22.0% | 15.2% | 13.5% |
| Working Capital Days | High (>110 Days) | 75 Days | 82 Days |
| CFO / PAT Conversion | 44.3% | 78.0% | 65.0% |
| Quartzite Sourcing | Transitioning to Captive | Third-Party Sourcing | Integrated Captive Sourcing |
The peer data shows that while Monolithisch India leads in top-line growth and operating margins, larger peers convert a higher proportion of earnings into operating cash flow through tighter working capital cycles.
Final Assessment: What to Watch Next
The Monolithisch India Q2FY27 update demonstrates clear commercial traction for premium SGB ramming mass, yielding strong revenue and profit growth.
Looking ahead, management’s primary focus will shift from product development to operational execution. In upcoming quarters, investors should monitor capacity utilization at Purulia, the progress of mining clearances at Nawada, and the conversion of accounting profits into operating cash flow.
However, the investment thesis now shifts from product-mix expansion to balance sheet and operational execution. Over the next two quarters, investors should track the following operational milestones:
- Purulia Plant Utilization: Track capacity utilization metrics and local volume off-take in Eastern India during Q3 and Q4 FY27.
- Mining Clearances: Monitor the timeline for the Nawada quartzite block’s commercial launch in January 2027 to verify the expected raw material cost drop to ₹1,400–1,500/tonne.
- Cash Flow Realization: Watch for an inflection in Operating Cash Flow (OCF) relative to PAT in the second-half financial reports, ensuring working capital requirements do not outpace internal cash generation.
- FY27 Guidance Delivery: Monitor quarterly progress toward the implied ₹149 Cr H2 revenue target required to meet the full-year ₹250 Cr revenue projection.
Disclaimer: The stock market analysis provided in this article is for educational and informational purposes only. It does not constitute financial advice. Always consult with a registered financial advisor before making any investment decisions.
Disclaimer: This article is for educational purposes only and not financial advice. Investors should do their own due diligence before investing.
Disclaimer: The projections of potential returns are based on current market conditions and company performance. Actual results may vary due to various factors, including market dynamics, economic conditions, and changes in the competitive landscape. Investors should conduct their own research and consult with financial advisors before making investment decisions.
Multibagger Stocks breakout stocks
⚠️ Not SEBI Registered—just here to share insights | 🚫 No paid services—everything shared is entirely free! 🧠 Always Learning and excited to grow together in this journey of market exploration.
📲 Join Our Investor Communities
🔹 Join our Telegram Channel: Multibagger Hunts
🔹 Join our WhatsApp Channel: Click to Join
✅ Free access
✅ Instant alerts
✅ Curated research for serious investors
TwitterXWhatsAppThreadsTelegramFacebookLinkedInGmailEmailShare