admin
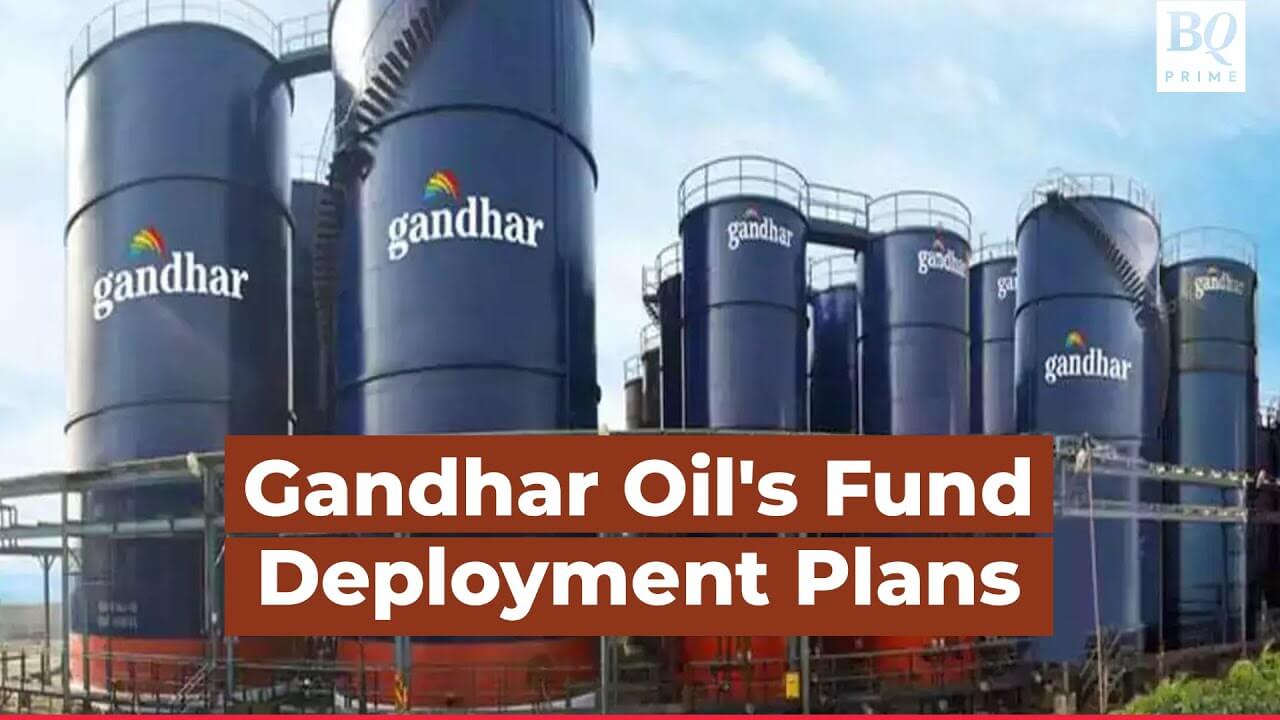
The Gandhar Oil Q2 FY27 results mark the strongest financial performance in the company’s operating history. Gandhar Oil Refinery (India) Ltd reported a consolidated net profit after tax (PAT) of ₹186.28 crore for the second quarter of FY27, up 368.4% from ₹39.77 crore in the same period last year. Consolidated revenue climbed 72.9% year-on-year to ₹1,846.56 crore, driven by elevated manufacturing gross spreads.
While these growth metrics have attracted strong market attention, investors must look beneath headline numbers. Specialty oil manufacturing operates within cyclical commodity spreads. This comprehensive report breaks down the revenue drivers, gross margin sustainability, working capital trends, and core risks shaping the company’s outlook.
1. Executive Earnings Scorecard: Q2 FY27 Financial Breakdown
The company reported strong gains across operating profitability metrics compared to the prior year. Sequentially, the company stabilized after an equally strong first quarter.
1. Headline Earnings Scorecard: Q2 FY27 vs. Prior Periods
The company delivered comprehensive expansion across top-line and operational profitability metrics on a year-on-year basis, while sequentially consolidating gains after an equally vigorous Q1 FY27.
| Financial Metric | Q2 FY27 (₹ Cr) | Q2 FY26 (₹ Cr) | YoY Growth (%) | Q1 FY27 (₹ Cr) | QoQ Growth (%) | H1 FY27 (₹ Cr) |
| Revenue from Operations | ₹1,846.56 | ₹1,068.11 | +72.88% | ₹1,731.90 | +6.62% | ₹3,578.46 |
| Other Income | ₹2.98 | ₹2.95 | +1.02% | ₹3.02 | -1.32% | ₹6.00 |
| EBITDA | ₹287.68 | ₹65.84 | +336.94% | ₹281.32 | +2.26% | ₹569.00 |
| EBITDA Margin (%) | 15.58% | 6.16% | +942 bps | 16.24% | -66 bps | 15.90% |
| Finance Costs | ₹8.20 | ₹12.45 | -34.14% | ₹9.10 | -9.89% | ₹17.30 |
| Depreciation & Amort. | ₹10.10 | ₹9.25 | +9.19% | ₹10.05 | +0.50% | ₹20.15 |
| PBT (Before Exceptional) | ₹269.38 | ₹51.14 | +426.75% | ₹263.77 | +2.13% | ₹533.15 |
| Exceptional Items (Loss) | (₹21.29) | ₹0.00 | N/A | ₹0.00 | N/A | (₹21.29) |
| Reported PBT | ₹248.09 | ₹51.14 | +385.12% | ₹263.77 | -5.95% | ₹511.86 |
| Tax Expense | ₹61.81 | ₹11.37 | +443.62% | ₹65.94 | -6.26% | ₹127.75 |
| Reported PAT | ₹186.28 | ₹39.77 | +368.39% | ₹205.88 | -9.52% | ₹392.16 |
| Minority Interest | ₹11.37 | ₹3.72 | +205.65% | ₹13.60 | -16.40% | ₹24.97 |
| PAT (Attributable) | ₹174.91 | ₹36.05 | +385.19% | ₹192.28 | -9.04% | ₹367.19 |
Official corporate filings, statutory disclosures, and regulatory submissions are accessible directly via theBSE Corporate Disclosures Portal.
2. Margin Dynamics: Decoding the ₹29,128/kL Manufacturing Spread
The central catalyst behind Gandhar Oil’s multi-fold earnings expansion is the extraordinary widening of its manufacturing gross spread.
- Gross Spread Explosion: Gandhar logged a manufacturing gross spread of ₹29,128 per kilolitre (kL) during Q2 FY27. This represents an almost three-fold surge compared to historical base-case ranges of ₹8,000–₹10,000/kL.
- QoQ Stability: Crucially, this spread remained stable compared to Q1 FY27, confirming that the initial margin surge witnessed earlier in the fiscal year was not an isolated one-month inventory valuation anomaly.
- Geopolitical Dislocation Premiums: Base oils—the principal raw material for white oils, liquid paraffin, and industrial lubricants—have undergone extreme supply chain dislocations in the Middle East and Europe. Global refining sanctions, crude feedstock route realignments, and shipping freight surcharges pushed international finished specialty oil prices higher faster than procurement costs for contracted base oil cargos.
Structural Shift or Cyclical Peak?
In the post-earnings investor conference call, company leadership struck an optimistic yet measured tone:
- Near-Term Guidance: Management expects gross margins to hover around current levels of approximately ₹29,000/kL through the remainder of FY27 (Q3 and Q4).
- The “New Normal” Baseline: Leadership asserted that even when international logistics and geopolitical disruptions normalize, gross spreads are unlikely to retrace to pre-conflict troughs of ₹8,000–₹9,000/kL. A higher structural baseline driven by premium pharmaceutical-grade white oils and institutional customer contracts is anticipated.
- Inherent Sensitivity: Investors must remember that specialty oil manufacturing is spread-based processing, not intellectual-property software. If global base oil refining capacities come online or freight rates normalize, processing crack spreads historically regress toward mean levels.
3. Volume vs. Realization: Deconstructing the Growth Drivers
A critical component of quality earnings analysis is separating price-led growth from volume-led expansion.
Total H1 FY27 Sales Volume: 2.64 Lakh kL (+0.9% YoY)
├── Domestic Standalone Volume: >15.0% YoY Growth (High Demand)
└── UAE Subsidiary (Texol): Negative Growth (Geopolitical / Shipping Bottlenecks)
Gandhar Oil’s overall sales volume for H1 FY27 came in at 2.64 Lakh kL, representing a modest volume uptick of just 0.9% YoY. This highlights that over 95% of the incremental revenue expansion was driven by realization growth and pricing power, rather than unit throughput gains.
The Divergence: Domestic Strength vs. Middle Eastern Drag
- Domestic Footprint (India Standalone): The standalone domestic business delivered strong volume expansion exceeding 15% YoY during the first half of the year. Robust infrastructure rollouts, state utility transformer investments, automotive lubricant off-take, and fast-moving consumer goods (FMCG) packaging demand supported strong domestic capacity absorption.
- Overseas Operations (Texol Lubritech, UAE): The company’s wholly owned overseas manufacturing arm in the UAE faced acute logistical headwinds. Unrest in the Red Sea and broader West Asian geopolitical tensions disrupted container bookings, escalated marine war-risk insurance premiums, and restricted export access to key Mediterranean and African destinations.
- Volume Guidance Revision: Management had initially guided for 8% to 11% consolidated volume growth for FY27. During the Q2 call, they conceded that achieving this target remains highly challenging due to external factors affecting the UAE subsidiary, despite the domestic Indian business running ahead of targets.
4. Segmental Breakdown & Revenue Contribution
Gandhar operates across three core business divisions alongside channel partner distribution. The product mix directly influences blended gross realization.
Q2 FY27 Consolidated Revenue Contribution by Segment:
┌──────────────────────────────────────────┬───────────┐
│ Segment                                  │ Share (%) │
├──────────────────────────────────────────┼───────────┤
│ Personal Care, Healthcare & Performance  │ 51.2%     │
│ Lubricants (Automotive & Industrial)     │ 24.8%     │
│ Channel Partner Distribution             │ 12.2%     │
│ Process & Insulating Oils (PIO)          │ 11.8%     │
└──────────────────────────────────────────┴───────────┘
Personal Care, Healthcare & Performance Oil (PHPO) – 51.2% Share
The PHPO division remains Gandhar Oil’s flagship revenue generator. Products include mineral oils, liquid paraffin, white petroleum jelly, and cosmetic-grade emollients:
- Customer Profile: The company supplies tier-1 multinational pharmaceutical and consumer health giants, including Unilever, Procter & Gamble, Marico, Dabur, and Emami.
- Performance: PHPO revenue held steady, benefiting from rigid vendor qualification standards. Switching suppliers in pharma and cosmetic applications requires protracted regulatory audits, granting Gandhar superior pricing stickiness relative to general industrial oils.
Lubricants (Automotive and Industrial) – 24.8% Share
Marketed under the proprietary “Divyol” brand as well as through private-label contracts:
- Automotive lubes saw steady replacement demand across commercial vehicles and agricultural tractors.
- Industrial lubricants registered double-digit off-take from steel, cement, and engineering fabrication units across Western and Northern India.
Process & Insulating Oils (PIO) – 11.8% Share (Volume Star)
While representing 11.8% of gross revenue, PIO was the standout operational driver:
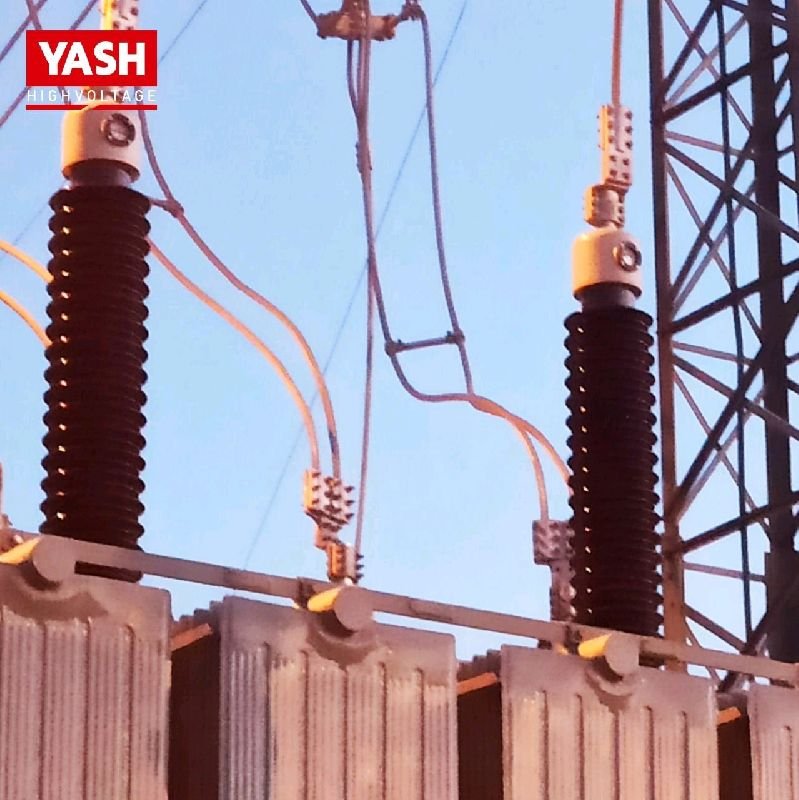
- 23.4% YoY Volume Surge: Driven primarily by high-voltage transformer oils, rubber process oils, and power distribution projects.
- Infrastructure Capex Tailwinds: Electrification projects by Power Grid Corporation of India, state electricity boards (SEBs), and export-oriented transformer manufacturers fueled aggressive purchase orders for specialized dielectric insulating fluids.
Channel Partners – 12.2% Share
Comprises specialized base oil distribution and traded product solutions to institutional partners, providing counter-cyclical volume flexibility when manufacturing utilization shifts.
For an extensive overview of macroeconomic raw material price movements and crack spread cycles across domestic refiners, review our detailed Specialty Chemical and Lubricant Industry Outlook.
5. Exceptional Item: Silvassa Plant Flood Damage
During Q2 FY27, Gandhar Oil booked an exceptional loss provision of ₹21.29 crore.
- Root Cause: In late July, torrential monsoon rainfall caused localized flooding at the company’s prime compounding facility in Silvassa (Union Territory of Dadra and Nagar Haveli).
- Financial Impact: Floodwaters contaminated raw base oil inventory, finished packaged oils, and damaged auxiliary electrical sub-stations, requiring immediate physical inventory write-downs and equipment repairs.
- Restoration Timeline: Operations were completely restored by mid-August following accelerated cleanup and maintenance procedures. In addition, the company completed planned debottlenecking, lifting consolidated capacity to approximately 8.39 Lakh kL per annum.
- Insurance Recovery Upside: Management noted that comprehensive commercial property and business interruption insurance claims have been lodged with underwriters. Following prudent Indian Accounting Standards (Ind AS), zero anticipated insurance recovery has been credited in the Q2 results. Any final insurance claim settlement will be booked as an exceptional gain in upcoming quarters.
6. Balance Sheet Quality, Working Capital & Cash Conversion
While profitability metrics soared, an institutional audit of Gandhar Oil’s balance sheet reveals notable working capital developments that warrant investor scrutiny.
H1 FY27 Cash Flow vs Profit Divergence:
Consolidated PAT:                    ₹392.2 Cr  ═══════════════════════════════╗
                                                                               ║  Working Capital
                                                                               ║  Absorption Gap
Operating Cash Flow (OCF):           ₹179.7 Cr  ═══════════════╝               ║  (-₹212.5 Cr)
The Cash Conversion Gap
- During H1 FY27, Gandhar generated ₹392.16 crore in consolidated net profit, yet Operating Cash Flow (OCF) stood at ₹179.70 crore, representing an OCF-to-PAT conversion ratio of 45.8%.
- Trade Receivables Balloon: Trade receivables expanded from ₹721 crore as of March 31, 2026, to ₹1,339 crore by September 30, 2026—an absolute increase of ₹618 crore in just six months.
- Why Did Receivables Expand?
- Top-line expansion of 73% naturally scales absolute trade credit balances.
- Extended credit windows offered to institutional transformer oil clients and international distributors navigating foreign currency liquidity constraints.
- Increased transit inventory and unbilled shipments linked to extended shipping routes around the Cape of Good Hope.
Investors should monitor cash conversion closely over H2 FY27. If receivables fail to liquidate into hard cash flow by Q4, working capital borrowing requirements could pick up.
Balance Sheet De-leveraging
On the liability side, management directed strong operational accruals toward long-term balance sheet health:
Gross Consolidated Debt Reduction:
March 2026:      ₹168.5 Cr  ■■■■■■■■■■■■■■■■■■■■
September 2026:   ₹84.6 Cr  ■■■■■■■■■■ (-49.8%)
- Gross Debt Reduction: Total borrowings declined by nearly 50% from ₹168.5 crore in March 2026 to ~₹84.6 crore in September 2026.
- Softening Finance Costs: Net finance charges dropped 34.1% YoY to ₹8.20 crore, aided by debt pay-downs and softening global SOFR benchmarks on foreign trade credit facilities.
- Credit Rating Validation: Rating agency CRISIL reaffirmed Gandhar Oil Refinery’s long-term bank facilities rating at CRISIL A+/Stable and short-term debt at CRISIL A1, while approving an increase in rated bank limits to ₹1,014 crore. For credit methodology details, refer to the CRISIL Credit Ratings Research Framework.
7. Strategic Growth Horizon & Capex Roadmap
To defend against eventual spread normalizations, Gandhar is actively deploying capital into three structural avenues:
Strategic Capital Allocation Plan:
├── 1. Value-Added Pharmaceutical Formulations (High-purity white oils, sterile petrolatums)
├── 2. Geographic De-risking (Direct distribution subsidiaries in US, Europe, Indonesia, South Africa)
└── 3. Internal Accrual Capex (Capacity expansion without raising long-term external debt)
- Climbing the Pharmaceutical Value Chain: The R&D pipeline is targeting high-purity microcrystalline waxes, specialty white oils, and synthetic biological process oils. These products command gross margins well north of 35% and exhibit low demand elasticity.
- International Geographic Expansion: Management is operationalizing dedicated regional distribution hubs across Indonesia, the United States, continental Europe, and South Africa to lessen dependence on Middle Eastern transit hubs.
- Brownfield Expansion Funded Internally: With consolidated annual capacity currently at 8.39 Lakh kL, management reiterated that all future expansion will be funded via internal cash accruals without straining the balance sheet.
8. Peer Comparison & Valuation Context
Evaluating Gandhar Oil requires benchmarking its financial metrics against key domestic specialty oil and lubricants peers: Apar Industries and Savita Oil Technologies.
| Financial Parameter | Gandhar Oil Refinery | Apar Industries | Savita Oil Technologies |
| Trailing P/E Ratio (x) | ~10.5x – 12.0x | ~34.0x – 38.0x | ~14.0x – 16.0x |
| Q2 FY27 EBITDA Margin (%) | 15.58% | 8.80% – 9.50% | 10.20% – 11.50% |
| Q2 FY27 YoY Revenue Growth | +72.88% | +18.50% | +14.20% |
| H1 FY27 Net Debt Status | Virtually Net Cash | Moderate Debt | Net Cash |
| Key Dominant Segment | Pharma/Personal White Oils | Transformer Oils / Conductors | Transformer & Auto Lubes |
| Global Export Footprint | 100+ Countries | 140+ Countries | 75+ Countries |
- Valuation Multiple Discount: Gandhar continues to trade at a substantial P/E multiple discount to broader specialty chemical peers. The market continues to treat Gandhar’s margins as cyclical rather than structural, pricing in an eventual spread normalization.
- The Valuation Debate: If Gandhar demonstrates over the next two quarters that manufacturing spreads can remain resilient above ₹22,000/kL while collections reduce receivables, a structural multiple re-rating could follow.
For a broader assessment of previous quarterly baselines and historical trading multiples, see our archive report: Gandhar Oil Q1 Earnings and Historical Valuation Roundup.
9. Key Monitorables & Risk Factors for Investors
Before taking an investment position, market participants must weigh key strategic risks:
- Spread Normalization: If geopolitical shipping channels reopen and base oil processing spreads retreat toward ₹12,000–₹14,000/kL, quarterly EBITDA could decline by 30% to 45% from current peaks.
- Working Capital Cycle & Cash Trapping: Receivables increased by ₹618 crore in six months. Failure to collect trade credit across subsequent quarters could force higher short-term borrowing and trigger bad-debt provisions.
- Middle East Geopolitical Exposure: The UAE subsidiary remains vulnerable to shipping corridors, container freight availability, and localized disruptions in West Asia.
- Foreign Currency & Crude Fluctuations: Base oil prices correlate with Brent crude and foreign exchange benchmarks (USD/INR). Extreme volatility can lead to timing mismatches between inventory intake costs and finished product billing.
Final Investment Takeaway
Gandhar Oil Refinery’s Q2 FY27 performance was a standout operational quarter that highlighted strong domestic positioning, agile inventory sourcing, and exceptional spread capture. Debt reduction, steady brownfield capacity debottlenecking to 8.39 Lakh kL, and a high-margin product mix underline solid management execution.
However, intelligent investing requires separating peak cyclical conditions from sustainable base rates. The company’s future stock performance hinges less on repeating 368% profit growth and more on:
- Converting its expanded receivables into operational cash flow.
- Defending manufacturing gross spreads above ₹20,000/kL as supply chains stabilize.
- Successfully scaling value-added pharmaceutical formulations globally.
Investors seeking exposure should look for sustained cash flow conversion in upcoming quarters before assuming current earnings run-rates represent a permanent baseline.
Disclaimer: The stock market analysis provided in this article is for educational and informational purposes only. It does not constitute financial advice. Always consult with a registered financial advisor before making any investment decisions.
Disclaimer: This article is for educational purposes only and not financial advice. Investors should do their own due diligence before investing.
Disclaimer: The projections of potential returns are based on current market conditions and company performance. Actual results may vary due to various factors, including market dynamics, economic conditions, and changes in the competitive landscape. Investors should conduct their own research and consult with financial advisors before making investment decisions.
Multibagger Stocks breakout stocks
⚠️ Not SEBI Registered—just here to share insights | 🚫 No paid services—everything shared is entirely free! 🧠 Always Learning and excited to grow together in this journey of market exploration.
📲 Join Our Investor Communities
🔹 Join our Telegram Channel: Multibagger Hunts
🔹 Join our WhatsApp Channel: Click to Join
✅ Free access
✅ Instant alerts
✅ Curated research for serious investors
TwitterXWhatsAppThreadsTelegramFacebookLinkedInGmailEmailShare