admin
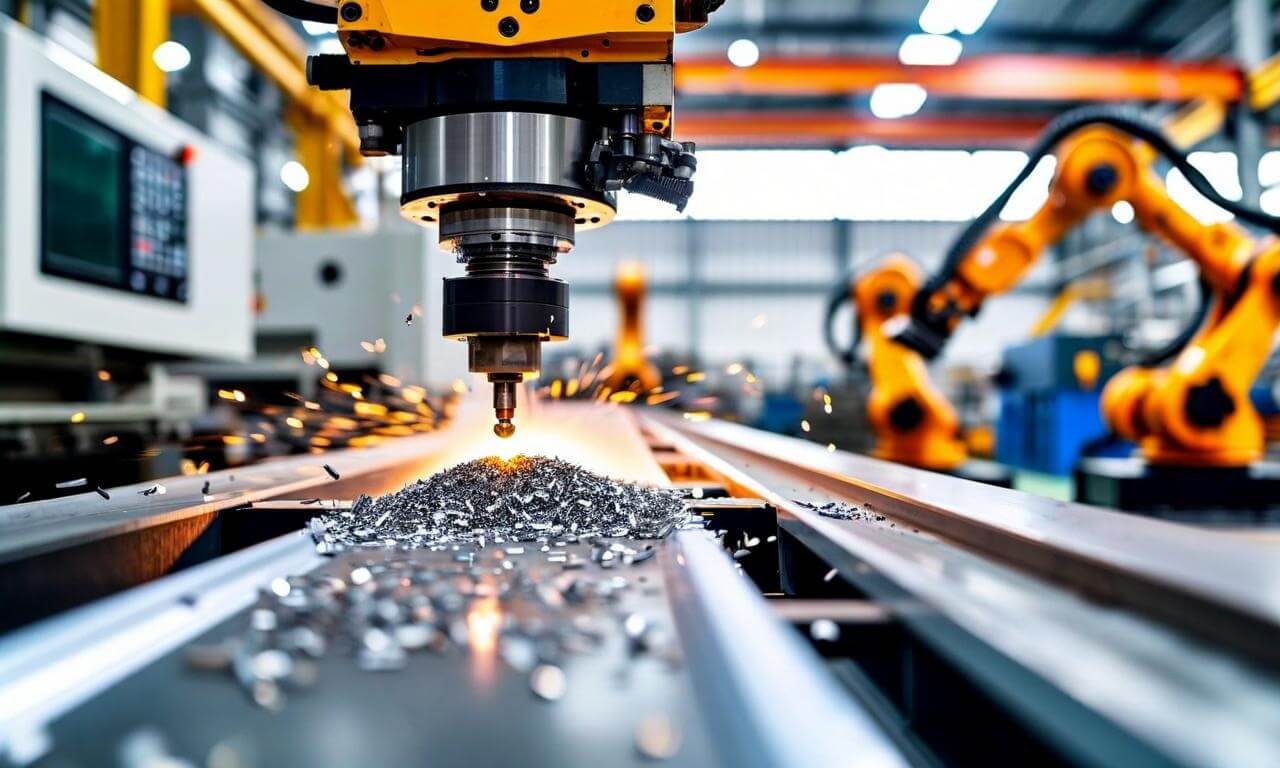
Introduction: Riding India’s Industrial Capex Supercycle
Macpower CNC Q2 FY27 Results: Revenue Analysis
Macpower delivered an exceptional operational performance during the second quarter. Specifically, operational revenue scaled to ₹120.33 crore, marking a robust 40.4% year-on-year (YoY) surge compared to ₹85.71 crore in Q2 FY26. Furthermore, revenue accelerated sequentially by 26.3% over the ₹95.24 crore recorded in Q1 FY27.
For the first half of fiscal 2027 (H1 FY27), total revenue reached ₹215.56 crore, representing a stellar 46.9% YoY growth. Therefore, this performance demonstrates consistent order execution across diverse industrial sectors.
Profit Trends and Operating Margins
Profitability outpaced top-line growth during the quarter. Specifically, Profit After Tax (PAT) surged 43.7% YoY to reach ₹13.48 crore in Q2 FY27, up from ₹9.38 crore in the corresponding quarter of the previous fiscal year.
Furthermore, EBITDA stood at ₹19.93 crore, yielding an EBITDA margin of 16.56%. Net profit margins expanded to 11.20%. In addition, Macpower maintains a completely debt-free balance sheet with a Return on Capital Employed (ROCE) exceeding 30%.
Product Portfolio and NEXA Series Expansion
A wider catalog alone does not ensure higher realisations. Instead, a manufacturer must transition into complex machinery. Macpower achieved this via its premium NEXA series.
Specifically, premium NEXA models now account for approximately 40% of the total pending order book. As a result, average machine realisations have trended upward to roughly ₹20.36 lakh per machine, lifting overall margins.
Capacity Expansion and Future Outlook
With existing shop floors operating near peak capacity, managing manufacturing throughput remains critical. To solve this, Macpower commenced construction on a new 13-acre manufacturing facility backed by a ₹50 crore capital outlay.
Consequently, management upgraded its full-year FY27 revenue growth guidance to nearly 35%, supported by a robust pending order book of ₹476 crore.
1. Revenue Analysis: Record-Breaking Trajectory in Q2 FY27
Macpower CNC delivered an exceptional operational performance in the second quarter of fiscal 2027, crossing significant financial milestones.
- Quarterly Revenue Surge: Operational revenue for Q2 FY27 scaled to ₹120.33 crore, marking a robust 40.4% year-on-year (YoY) increase compared to ₹85.71 crore in Q2 FY26. Sequentially, the top line accelerated by 26.3% over the ₹95.24 crore recorded in Q1 FY27.
- H1 FY27 Cumulative Performance: For the first half of FY27, total revenue reached ₹215.56 crore, recording a stellar 46.9% YoY growth. This performance underscores consistent order execution and strong baseline demand across diverse industrial sectors.
- Order Book Visibility: The company closed Q2 FY27 with a robust pending order book of ₹476 crore (up ~36% YoY). This provides clear revenue visibility equal to nearly four times its quarterly run rate. Furthermore, the total active bid pipeline—spanning domestic tenders and government opportunities—stands at an impressive ₹939 crore.
2. Profit Trends and Margins: Operating Leverage in Action
Profitability outpaced top-line growth during the quarter, driven by optimized cost structures, scale advantages, and a favorable product mix leaning toward advanced machinery.
- Net Profit Growth: Profit After Tax (PAT) surged 43.7% YoY to reach ₹13.48 crore in Q2 FY27, up from ₹9.38 crore in the corresponding quarter of the previous fiscal year. On a half-yearly basis, H1 FY27 PAT jumped 65.5% YoY to ₹23.60 crore.
- Margin Expansion: EBITDA for the quarter stood at ₹19.93 crore, registering a 40.8% YoY growth with an EBITDA margin of 16.56%. Net profit margins expanded to 11.20%, reflecting steady operating leverage as fixed overheads spread across higher production volumes.
- Capital Efficiency & Balance Sheet Strength: Macpower maintains a completely debt-free balance sheet (debt-to-equity ratio of 0.0) with a healthy net cash surplus. The company’s Return on Capital Employed (ROCE) continues to hover above 30%, demonstrating exceptional capital allocation discipline and efficient internal cash generation.
3. Product Portfolio Evolution: The Rise of the NEXA Series
A wider catalog alone does not ensure higher realisations; a manufacturer must successfully transition into machines that solve complex engineering problems. Macpower has systematically achieved this through its premium NEXA series.
- The Shift Toward Sophistication: The NEXA series represents Macpower’s high-end portfolio, featuring advanced machines like double-column machining centres (e.g., DCM-5227), specialized vertical milling centres for graphite machining (V500 G), and vertical turning lathes equipped with live-tool turrets (VTX 1200 L).
- Order Book Contribution: Premium NEXA models now account for approximately 40% of the total pending order book, signaling that core industrial customers are increasingly adopting Macpower for high-precision, heavy-duty applications.
- Average Realisations: Driven by this premiumization strategy, average machine realisations have trended upward to roughly ₹20.36 lakh per machine in Q2 FY27, directly lifting margins and insulating the company from low-cost commoditized competition.
4. Industry Comparison & Macroeconomic Positioning
India’s machine-tool ecosystem is riding a structural manufacturing upcycle. According to the Indian Machine Tool Manufacturers’ Association (IMTMA), domestic machine-tool consumption has expanded past ₹36,500 crore, driven by rising localized production under various manufacturing incentives.
| Parameter | Macpower CNC Standpoint | Sector Context |
| Domestic Market Share | ~4% of domestically produced machine tools | Substantial room for domestic import substitution as India targets ₹50,000+ crore consumption by 2030. |
| Product Breadth | 388+ variants across 27+ product categories | Diverse portfolio protects against cyclical downturns in single-end markets like automotive or agriculture. |
| Financial Leverage | Debt-free (0.0 D/E), interest coverage >130x | Superior financial health compared to leveraged capital goods peers, allowing unhindered capex funding. |
To explore broader peer comparisons and deep-dive valuation metrics, visit Screener’s Macpower Profile.
5. Capacity Expansion & Strategic Outlook
With existing shop floors operating near peak utilization (~95% capacity), managing manufacturing throughput is critical for sustaining double-digit growth.
- Greenfield Expansion Plans: To alleviate near-term constraints, Macpower has commenced construction on a newly acquired 13-acre manufacturing facility supported by an estimated capital expenditure of ₹50 crore. This facility is expected to become fully operational within a 12-month horizon (targeted by Q2 FY28), providing the headroom required to support future volume growth over the next 3 to 4 years.
- Sales & Service Network Expansion: The company is simultaneously expanding its geographic footprint. Four new technical centres in Kolhapur, Mumbai, Chennai, and Aurangabad are slated to become operational in Q3 FY27, backed by plans to double its dedicated sales and service personnel.
- Revised Guidance: Bolstered by a strong H1 performance and robust order visibility, management has upgraded its full-year FY27 revenue growth guidance to nearly 35%.
6. Investment Perspective: Key Risks and Opportunities
Key Growth Catalysts
- Import Substitution Tailwinds: High-end engineering sectors are increasingly looking inward, replacing costly European and Japanese imports with reliable domestic alternatives.
- Operating Leverage: As the new 13-acre plant comes online and high-margin NEXA models command a larger share of deliveries, fixed-cost efficiencies will likely preserve or enhance EBITDA margins.
- Robust Order Backlog: A ₹476 crore order book combined with ₹939 crore in active bids provides multi-quarter revenue visibility.
Potential Risks & Considerations
- Capacity Constraints in the Interim: Operating near full capacity creates a short-term ceiling on volume growth until the new greenfield facility is commissioned.
- Cyclicality in Capital Goods: Demand for machine tools is closely tied to broader industrial capital expenditure cycles, making the company sensitive to macroeconomic slowdowns or sudden spikes in raw material costs (such as specialized cast iron and electronic controllers).
- Strategic Niche Focus: While competitors focus on hyper-niche 5-axis machines plagued by import-control restrictions and complex supply chains, Macpower’s pragmatic focus on 3+1 and 4+1 configurations limits immediate exposure to high-end defense segments.
An analysis of Macpower CNC Machines Limited reveals how its valuation multiples and financial health measure up against broader Indian capital goods and industrial machinery peers.
1. Valuation Multiples & Stock P/E Analysis
Macpower CNC trades at premium valuation multiples, reflecting strong market enthusiasm for its structural growth, robust order backlog, and clean balance sheet.
- Stock Price & Market Cap: Trading around ₹2,098 per share, Macpower commands a small-cap market capitalization of approximately ₹2,100 crore.
- Price-to-Earnings (P/E) Ratio: Macpower’s trailing twelve months (TTM) P/E ratio hovers around 45x to 48x. While this is elevated relative to historical manufacturing averages, it aligns closely with high-growth specialized industrial and capital goods players in India experiencing structural tailwinds.
- Price-to-Book (P/B) Ratio: The stock trades at a P/B multiple of ~10.1x to 11.1x, backed by a strong book value per share of ~₹175.
- EV/EBITDA: Macpower’s Enterprise Value to EBITDA stands at ~30.3x, indicating that the market is pricing in sustained operational leverage and aggressive earnings compounding over the next few years.
2. Financial Performance & Return Ratios Comparison
Macpower’s valuation premium is largely underpinned by its superior operational efficiency and balance sheet quality relative to typical capital goods peers.
| Financial Metric / Ratio | Macpower CNC | Broad Capital Goods / Industrial Peers (Average Range) |
| Return on Equity (ROE) | ~21.3% – 23.5% | Typically 12% – 18% |
| Return on Capital Employed (ROCE) | ~29.4% | Typically 14% – 22% |
| Debt-to-Equity Ratio | 0.00 (Debt-Free) | Often 0.2x – 0.8x (heavy asset base) |
| Interest Coverage Ratio | >130x | Varies widely based on leverage |
| Net Profit Margins | ~11.1% | Typically 6% – 10% for machinery builders |
- Capital Discipline: Unlike many capital goods peers that rely on heavy debt financing to fund shop-floor expansions, Macpower maintains a debt-free status.
- Working Capital & Cash Generation: The company maintains an efficient cash conversion cycle (~70 days) and a healthy current ratio of 2.34, allowing it to fund greenfield expansions (such as its new 13-acre facility) comfortably through internal accruals and operational cash flows.
3. Peer Group Context in the Indian Machine Tools Sector
When compared against specialized CNC peers (such as Jyoti CNC Automation) and broader industrial machinery providers, Macpower occupies a unique niche:
- Scale vs. Agility: While larger tier-1 capital goods players or imported brands dominate mega-scale industrial setups, Macpower has carved out a strong domestic footprint by serving diverse sectors (automotive, general engineering, and defense) with over 388 product variants.
- Growth Premium: Macpower’s recent quarterly performance—highlighted by a ~40% YoY surge in revenue and over 40% growth in net profit—outpaces many legacy industrial peers, justifying a higher valuation multiple for its earnings growth.
Summary Perspective
Macpower CNC’s valuation multiples (~45x–48x P/E and ~11x P/B) are undeniably rich. However, they are supported by structural growth drivers: zero debt, robust return ratios (ROCE near 30%), margin expansion via the premium NEXA series, and multi-quarter revenue visibility anchored by a robust order book.
Disclaimer: The stock market analysis provided in this article is for educational and informational purposes only. It does not constitute financial advice. Always consult with a registered financial advisor before making any investment decisions.
Disclaimer: This article is for educational purposes only and not financial advice. Investors should do their own due diligence before investing.
Disclaimer: The projections of potential returns are based on current market conditions and company performance. Actual results may vary due to various factors, including market dynamics, economic conditions, and changes in the competitive landscape. Investors should conduct their own research and consult with financial advisors before making investment decisions.
Multibagger Stocks breakout stocks
⚠️ Not SEBI Registered—just here to share insights | 🚫 No paid services—everything shared is entirely free! 🧠 Always Learning and excited to grow together in this journey of market exploration.
📲 Join Our Investor Communities
🔹 Join our Telegram Channel: Multibagger Hunts
🔹 Join our WhatsApp Channel: Click to Join
✅ Free access
✅ Instant alerts
✅ Curated research for serious investors
TwitterXWhatsAppThreadsTelegramFacebookLinkedInGmailEmailShare