admin
India Inc Q2 FY27 Earnings Scorecard: Deepak Nitrite Outperforms, SFBs Rebound, and Industrial Momentum Strengthens
The evening corporate earnings announcements on October 29, 2026, brought significant divergence across sectors, highlighting raw material price stabilization, selective operational leverage, and varying credit cost cycles. From specialty chemicals rebounding from cyclically depressed baselines to regional banking franchises demonstrating asset quality normalization, Q2 FY27 reflects clear operating margin expansion for disciplined cost managers.
Investors assessing corporate fundamentals in this earnings cycle must look past headline top-line numbers. Operating cash flow generation, working capital discipline, and segmental margin trajectory reveal which companies are experiencing structural demand recovery versus transient quarterly bounces.
Executive Summary: Key Earnings Highlights at a Glance
| Company | Sector | Revenue (Cr) | YoY Growth (%) | Operating Metric | Net Profit / PAT (Cr) | Strategic Takeaway |
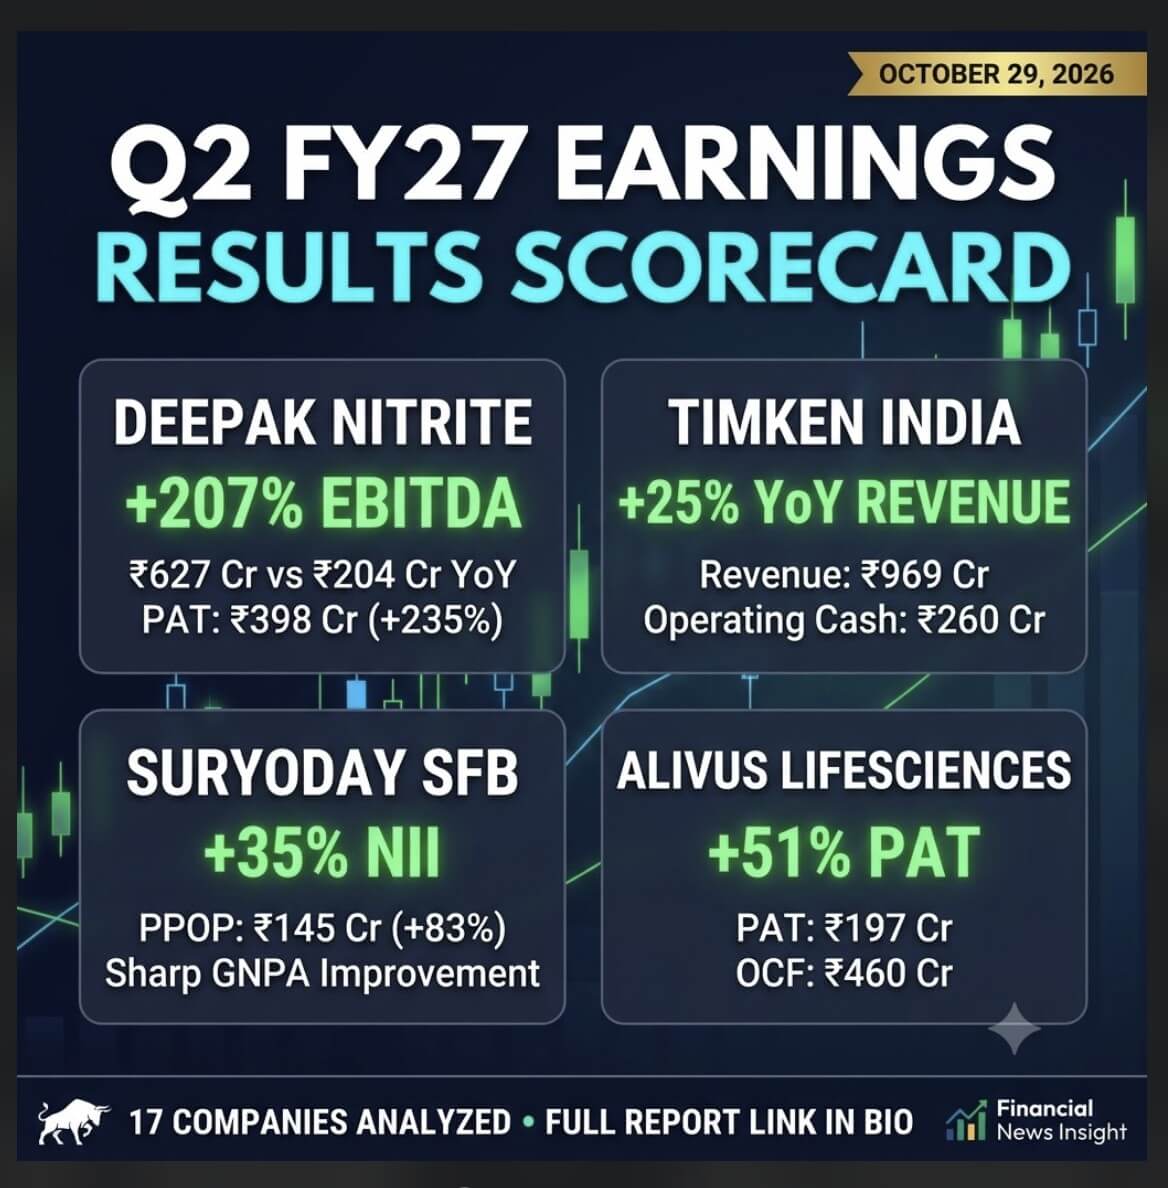
| Deepak Nitrite | Specialty Chemicals | ₹3,076 | +61.8% | EBITDA: ₹627 Cr (+207% YoY) | ₹398 Cr | Operational volume recovery; inventory stability confirmed. |
| Suryoday SFB | Banking / Small Finance | — | NII: +35% | PPOP: ₹145 Cr (+83.5% YoY) | ₹77 Cr | Sharp GNPA improvement; credit costs easing. |
| Timken India | Industrial Engineering | ₹969 | +25.4% | PBT: ₹156 Cr (+28.9% YoY) | ₹117 Cr | Sustained rail & auto demand; healthy operating cash. |
| Alivus Lifesciences | Pharma / CDMO | ₹682 | +16.0% | PBT: ₹262 Cr (+50.6% YoY) | ₹197 Cr | Margin expansion via specialized active formulations. |
| AYM Syntex | Specialty Textiles | ₹451 | +29.2% | Turnaround to PBT: ₹27 Cr | ₹15 Cr | Operational turnaround driven by high-margin synthetic lines. |
| Sanofi India | Pharmaceuticals | ₹491 | +3.2% | PBT: ₹158 Cr (+21.5% YoY) | ₹117 Cr | Margin-led recovery despite subdued top-line velocity. |
| Indegene | Healthcare Tech | ₹1,122 | +39.6% | EBITDA: +32% YoY | PBT: ₹147 Cr | Top-line scale offset by depreciation and financing costs. |
| Capital SFB | Banking / Small Finance | — | NII: +20% | RoA: 1.39% vs 1.26% | PBT: ₹62 Cr | Asset quality improvement; structurally low credit provisions. |
Specialty Chemicals & Industrial Materials
Specialty chemical manufacturers have endured nearly eight quarters of aggressive global destocking, dumping pressures from surplus overseas capacity, and volatile raw material spreads. The Q2 FY27 earnings print marks a clear pivot toward domestic demand realization and stable product realizations.
1. Deepak Nitrite: Structural Volume Growth and Operating Leverage
Deepak Nitrite delivered the standout earnings report of the session, surpassing market consensus across sales, operational earnings, and free cash conversion.
Revenue: ₹3,076 Cr (+61.8% YoY | +19.4% QoQ)
EBITDA:  ₹627 Cr (+207.4% YoY | +16.1% QoQ)
PBT:     ₹543 Cr (+233.1% YoY | +16.0% QoQ)
PAT:     ₹398 Cr (+234.5% YoY | +15.4% QoQ)
OCF:     ₹651 Cr (vs ₹204 Cr YoY)
- Segmental Drivers: The Phenolics division expanded 72% YoY, supported by high capacity utilization at downstream derivative facilities and firm phenol-acetone spreads. Advanced Intermediates demonstrated healthy demand elasticity, growing revenue 38% YoY.
- Cash Flow and Balance Sheet Quality: Operating cash flow (OCF) reached ₹651 crore for the first half, eclipsing last year’s ₹204 crore. Crucially, management’s prior commentary that Q1 lacked transient inventory profits was validated: gross margins held steady without raw-material write-backs.
- Investor Implication: The company is executing its capital expenditure transition toward downstream fluorochemicals and polycarbonate polymers. Track official corporate disclosures via the National Stock Exchange of India (NSE) for project commissioning schedules. Deepak Nitrite stands out as an early beneficiary of the chemical sector’s inflection point.
Deepak Nitrite Segmental Revenue Growth (YoY):
Phenolics:               [==================================] +72%
Advanced Intermediates:  [==================] +38%
Overall Revenue:         [=============================] +62%
2. Archean Chemical: Base Normalization in Bromine Derivatives
Archean Chemical posted modest sequential stabilization, working off a severely depressed baseline from Q2 FY26.
- Financial Summary: Revenue stood at ₹297 crore (up 27.5% YoY from ₹233 crore, but declining 9.2% QoQ from ₹327 crore). PBT settled at ₹46 crore compared to ₹40 crore in Q2 FY26 and ₹44 crore in Q1 FY27.
- Operational Reality: Industrial bromine realizations in global merchant markets have bottomed, but export prices have yet to display sustained pricing power. The sequential drop in revenue indicates volume softness in specialized marine salts and flame retardants.
- Strategic Outlook: Investors should look for updates on derivative capex commissioning, which will reduce Archean’s reliance on commoditized bromine exports and elevate blended margins.
Banking & Financial Services: Small Finance Banks
Small Finance Banks (SFBs) demonstrated solid balance-sheet resilience in Q2 FY27. The central theme across both reporting institutions was the steady normalization of unsecured loan slippages, leading to reduced credit provisioning and expanding Pre-Provision Operating Profit (PPOP).
SFB Performance Snapshot:
Metric               Suryoday SFB       Capital SFB
----------------------------------------------------
NII Growth (YoY)         +35%              +20%
Operating Profit (PPOP) ₹145 Cr           ₹65 Cr
Return on Assets (RoA)   0.37%             1.39%
Asset Quality Trend     GNPA Down         GNPA & NNPA Down
1. Suryoday Small Finance Bank: Credit Normalization Underway
Suryoday SFB posted operational momentum supported by strong Net Interest Income (NII) expansion and declining asset stress.
- Earnings Metrics: NII grew 35% YoY. PPOP climbed to ₹145 crore against ₹79 crore in the prior-year period. Net profit stood at ₹77 crore (up 156.7% YoY from ₹30 crore).
- Credit Quality & Return Ratios: Gross Non-Performing Assets (GNPA) contracted sharply both quarter-on-quarter and year-on-year, confirming that rural and semi-urban collection cycles are improving. While Net NPA ticked up marginally sequentially, overall provision cover remains sufficient. Return on Assets (RoA) improved to 0.37% from 0.19% YoY.
- Strategic Read: For sustainable re-rating, Suryoday must lift its RoA profile closer to the peer average of 1.20% by cross-selling secured retail assets and reducing high-cost borrowing lines.
2. Capital Small Finance Bank: High-Quality Balance Sheet Compounding
Capital SFB delivered a characteristically stable print, underscoring its focus on secured middle-market lending.
- Key Parameters: NII advanced 20% YoY. PPOP grew to ₹65 crore from ₹51 crore in Q2 FY26. PBT expanded to ₹62 crore, driven by lower credit provisions QoQ.
- Asset Quality: Both GNPA and NNPA trended downward sequentially and annually. RoA climbed to a healthy 1.39% (up from 1.26% YoY).
- Key Differentiator: With approximately 99% of its loan book secured by residential, commercial, or agricultural collateral, Capital SFB avoids the volatility seen in pure-play microfinance books. Explore our comprehensive primer on evaluating Indian small finance bank asset quality to compare structural credit risk profiles.
3. Asset Reconstruction Company (India) Limited (ARCIL): Core Realization Trends
- Earnings Metrics (Standalone): Revenue reached ₹237 crore (up 7.7% YoY, down from ₹274 crore in Q1). PBT rose to ₹198 crore from ₹161 crore YoY. Net profit came in at ₹147 crore vs ₹120 crore in Q2 FY26.
- Analytical Takeaway: ARCIL’s standalone financials offer a cleaner operational picture than consolidated numbers, which carry volatility from security receipt provisions. Consolidated PBT and PAT showed larger nominal figures due to lumpy distressed asset recoveries, but standalone cash collections remain the key gauge of health.
Healthcare, Pharmaceuticals & Life Sciences
The domestic pharmaceutical and CDMO sectors are experiencing divergence: pure-play formulation businesses are leaning on price discipline to drive margins, while technology-led healthcare providers are trading short-term margins for top-line expansion.
1. Alivus Lifesciences: Margin Expansion Across Formulations
Alivus Lifesciences reported broad-based strength, expanding both operating leverage and cash generation.
- Financial Summary: Revenue rose to ₹682 crore (+16.0% YoY, +6.6% QoQ). PBT climbed to ₹262 crore (+50.6% YoY, +23.6% QoQ). PAT finished at ₹197 crore (+51.5% YoY).
- Cash Conversion: Half-year operating cash flow reached ₹460 crore, compared to ₹261 crore in H1 FY26, highlighting strict working capital controls and reduced days sales outstanding (DSO).
- Drivers: Higher-margin active pharmaceutical ingredients (APIs) and regulated market shipments drove profitability, cushioning the business against baseline domestic cost inflation.
2. Sanofi India: Operating Margins Offset Muted Volume Growth
Sanofi India’s Q2 FY27 print was an operational turnaround on the margin line, even as revenue growth remained modest.
Revenue: ₹491 Cr (+3.2% YoY | +12.1% QoQ)
PBT:     ₹158 Cr (+21.5% YoY | +41.1% QoQ)
PAT:     ₹117 Cr (+51.9% YoY | +39.3% QoQ)
- Margin Drivers: After several quarters of channel adjustments and operational restructuring, supply chain optimizations took effect. Raw material cost stabilization and rationalized marketing expenditures enabled profit expansion despite single-digit annual revenue growth.
- Outlook: The long-term trajectory depends on expanding core chronic therapies (such as diabetes and cardiovascular treatments) and the success of its domestic distribution tie-ups.
3. Indegene: Top-Line Scale Balanced by Capital Costs
Indegene delivered strong revenue expansion, though operating cost inflation trimmed bottom-line conversion.
- Financial Highlights: Revenue expanded 39.6% YoY to ₹1,122 crore (+5.6% QoQ from ₹1,063 crore). EBITDA grew 32% YoY. PBT came in at ₹147 crore (up from ₹133 crore YoY, but lower than ₹153 crore in Q1 FY27).
- Headwinds: Earnings conversion was tempered by higher finance costs and accelerated depreciation schedules from recent digital enterprise investments.
- Valuation Perspective: Enterprise clients in biopharma are increasing adoption of commercialization and clinical workflow automation. Sustained margin expansion will require Indegene to integrate these technology platforms without further expanding overheads.
Industrial Engineering, Manufacturing & Consumer Tech
Mid & Small-Cap Industrial Summary:
Company               H1/Q2 Rev    YoY Trend    Key Driver
--------------------------------------------------------------------------
Timken India          ₹969 Cr      +25.4%       Rail/Commercial Vehicle demand
Teamtech Formwork      ₹49 Cr      +206.3%      Infrastructure construction spend
Silver Touch Tech     ₹100 Cr      +19.0%       Enterprise digital transformation
AYM Syntex            ₹451 Cr      +29.2%       Turnaround to profitability
Srivasavi Tapes        ₹70 Cr      +32.1%       Industrial adhesive consumption
Seshassai Tech        ₹405 Cr      +15.1%       Lower finance costs; margin lift
1. Timken India: Industrial and Mobility Tailwinds
Timken delivered consistent operational execution, driven by demand for heavy engineering bearings and rail components.
- Earnings Metrics: Revenue reached ₹969 crore (+25.4% YoY, +4.3% QoQ). PBT rose to ₹156 crore (+28.9% YoY). PAT reached ₹117 crore (+31.5% YoY). Operating cash flow remained healthy at ₹260 crore versus ₹235 crore in the prior period.
- Core Drivers: Indian Railways’ ongoing capacity programs, combined with steady heavy commercial vehicle production, supported capacity utilization at its bearing plants.
- Risk Monitor: Global export demand remains uneven; monitoring supply-chain data from European heavy-machinery markets will be important for assessing overseas order volumes.
2. Turnarounds & Micro-Cap Growth: Teamtech, AYM Syntex, and Srivasavi
- Teamtech Formwork Solutions (H1 FY27): Revenue surged to ₹49 crore compared to ₹16 crore in H1 FY26. PBT increased to ₹14 crore (from ₹4 crore), while PAT expanded to ₹10 crore (from ₹3 crore). Government-backed civil infrastructure and transit projects drove high utilization for modern scaffolding and formwork systems.
- AYM Syntex: Turned around from a net loss in Q2 FY26 to a PBT of ₹27 crore and PAT of ₹15 crore on revenues of ₹451 crore (+29.2% YoY). Better product mix in specialized multi-polymer yarns and lower thermal energy costs supported the turnaround. OCF improved to ₹46 crore from ₹38 crore.
- Srivasavi Adhesive Tapes (H1 FY27): Revenue grew to ₹70 crore from ₹53 crore in H1 FY26. EBITDA rose to ₹7 crore (10.0% margin) from ₹4.5 crore, while PAT expanded to ₹3.8 crore from ₹3.0 crore, driven by automotive and consumer electronics adhesive demand.
3. IT, Edutech & Consumer Small-Caps
- Silver Touch Technologies: Revenue touched ₹100 crore (+19.0% YoY, +29.9% QoQ), with PAT rising to ₹13 crore from ₹7 crore YoY. However, operating cash conversion was soft at ₹0.9 crore versus ₹17 crore in the prior period, pointing to capital tied up in receivables toward the close of the quarter.
- Seshassai Technologies: Revenue reached ₹405 crore (+15.1% YoY), with EBITDA up 12% alongside lower finance costs. PBT stood at ₹95 crore (vs ₹76 crore YoY), PAT came in at ₹70 crore (vs ₹58 crore), and OCF rose sharply to ₹97 crore from ₹39 crore.
- South Indian Paper Mills: Revenue held flat at ₹116 crore (vs ₹112 crore YoY and ₹118 crore in Q1). PBT improved to ₹5.8 crore from ₹3.7 crore YoY, supported by lower waste-paper raw material costs. OCF expanded to ₹24 crore from ₹14 crore.
- Fusion Klassroom Edutech (H1 FY27): Top-line rose to ₹15 crore from ₹12 crore YoY, with PBT increasing to ₹6.4 crore from ₹4.8 crore and OCF holding at ₹4.7 crore, reflecting steady hybrid education demand.
- Axita Cotton: Revenue remained largely range-bound at ₹68 crore vs ₹63 crore YoY (up from ₹58 crore in Q1). PBT rebounded to ₹7.2 crore from a low base of ₹0.1 crore, while PAT reached ₹5.5 crore (vs ₹0.3 crore YoY). OCF turned positive to ₹16 crore, reversing a negative ₹15 crore outflow in the prior-year period.
Macro Context and Strategic Implications for Investors
The October 29 earnings reports show that the corporate recovery in India is shifting from broad, index-level top-line growth to company-specific operating leverage and margin defense.
Sector Allocation Checklist for FY27:
* Specialty Chemicals: Focus on integrated downstream players (e.g., Deepak Nitrite);
  avoid stand-alone commodity producers lacking domestic scale.
* Banking & SFBs:       Prioritize secured lenders with RoA profiles > 1.25% (e.g., Capital SFB);
  monitor unsecured slippages at turnaround institutions.
* Industrials:          Track capital conversion and OCF health; demand remains solid
  across rail, infrastructure, and heavy transport.
- Working Capital and Cash Flow Conversion: Companies like Deepak Nitrite (OCF at ₹651 crore) and Seshassai Technologies (OCF at ₹97 crore) showed that reported net profits translated into balance-sheet liquidity. Conversely, when OCF decouples from PAT—as observed with Silver Touch Technologies—investors should review working capital and receivable cycles in the balance sheet notes.
- Input Cost Stabilization: Across chemicals, paper packaging, and synthetic textiles, gross margins are no longer suffering from the acute inventory destocking cycle of FY25–FY26. Companies with captive power, backward integration, and downstream specialty derivatives are capturing most of this operating spread.
- Credit Risk Pricing: For Small Finance Banks, the phase of aggressive balance-sheet cleanups is moderating. Institutions that avoided excessive concentrations in uncollateralized lending are producing consistent RoA expansion with manageable provisioning costs.
Investors should cross-reference these quarterly earnings reports with company management conference calls and statutory corporate filings available on the BSE India Corporate Announcements Portal. Analyzing operating cash conversion alongside operating margins helps separate true structural turnarounds from transient quarterly beats.
Disclaimer: This article is for educational purposes only and not financial advice. Investors should do their own due diligence before investing.
Disclaimer: The projections of potential returns are based on current market conditions and company performance. Actual results may vary due to various factors, including market dynamics, economic conditions, and changes in the competitive landscape. Investors should conduct their own research and consult with financial advisors before making investment decisions.
Multibagger Stocks breakout stocks
⚠️ Not SEBI Registered—just here to share insights | 🚫 No paid services—everything shared is entirely free! 🧠 Always Learning and excited to grow together in this journey of market exploration.
📲 Join Our Investor Communities
🔹 Join our Telegram Channel: Multibagger Hunts
🔹 Join our WhatsApp Channel: Click to Join
✅ Free access
✅ Instant alerts
✅ Curated research for serious investors
TwitterXWhatsAppThreadsTelegramFacebookLinkedInGmailEmailShare