admin

Maxvolt Energy H1 FY27 Results: Revenue Nearly Doubles to ₹243 Crore, But Debt and Cash Flow Demand Close Scrutiny
The Maxvolt Energy H1 FY27 results deliver a classic high-growth manufacturing paradox that every serious small-cap and SME investor needs to dissect carefully. On the income statement, the lithium-ion battery manufacturer posted blockbuster expansion, with revenue from operations surging 86.8% year-on-year (YoY) to ₹242.96 crore and net profit climbing 55.4% YoY to ₹20.08 crore.
Yet beneath the surface of surging top-line demand from India’s booming electric two-wheeler (2W) and three-wheeler (3W) ecosystem, the balance sheet reveals tightening liquidity. Operating cash flow slipped deeper into negative territory at -₹46.32 crore, cash reserves narrowed to ₹0.38 crore, and total debt rose to ₹134.70 crore to fund rapid working capital expansion and capital expenditure.
For investors tracking NSE Emerge stocks—especially companies listed via SME IPOs in 2025—understanding the gap between accounting profits and actual cash conversion is critical. Below is an in-depth, data-driven breakdown of Maxvolt Energy’s H1 FY27 financial performance, capex utilization, Maxvolt Re-Earth recycling catalyst, and valuation multiples at ₹386 per share.
Key Highlights of Maxvolt Energy H1 FY27 Results
- Explosive Top-Line Growth: Revenue from operations jumped 86.8% YoY to ₹242.96 crore (up from ~₹130 crore in H1 FY26), while total income including other income reached ₹248 crore.
- Strong Earnings Momentum: EBITDA grew 57.2% YoY to ₹28.98 crore (11.93% margin), and Profit After Tax (PAT) rose 55.4% YoY to ₹20.08 crore (8.26% net margin).
- Sequential (HoH) Acceleration: Compared to H2 FY26 revenue of ₹167 crore and PAT of ₹11 crore, H1 FY27 delivered a 45.5% sequential jump in revenue and an 82.5% surge in net profit.
- Trailing Twelve Months (TTM) Outperformance: TTM revenue now stands at ₹416 crore (vs. ₹299 crore in full-year FY26), while TTM PAT reached ₹31 crore (vs. ₹24 crore in FY26).
- Working Capital & Debt Strain: Operating cash flow stood at -₹46.32 crore (compared to -₹29 crore earlier), pushing total debt up to ₹134.70 crore and bringing cash balances down to ₹0.38 crore.
- Valuation Compression: Despite rallying more than 114% from its February 2025 SME IPO price of ₹180 to ~₹386, surging earnings compressed the stock’s trailing P/E multiple from 17.3x down to 13.4x–13.6x.
1. H1 FY27 Financial Performance Breakdown: Revenue, Margins, and Profitability
Evaluating half-yearly SME earnings requires looking at both Year-on-Year (YoY) comparisons—which eliminate seasonal distortions—and Half-on-Half (HoH) sequential trends, which reveal immediate operational momentum. On both fronts, the Maxvolt Energy H1 FY27 results confirm that order execution has scaled substantially over the past six months.
Core Operational vs. Total Income Numbers
When reviewing financial disclosures for Maxvolt Energy, investors will notice two closely related revenue sets depending on whether non-operating other income is included:
- Revenue from Operations (Core Business): Reached ₹242.96 crore in H1 FY27, compared to ₹167 crore in H2 FY26 and ~₹130 crore in H1 FY26.
- Total Income (Including Other Income): Came in at ₹248 crore in H1 FY27, versus ₹168 crore in H2 FY26 and ₹131 crore in H1 FY26.
For fundamental valuation and margin analysis, institutional analysts focus primarily on Revenue from Operations (₹242.96 crore) because it reflects pure manufacturing and battery-pack assembly demand.
H1 FY27 Financial Comparison Table (YoY & HoH)
| Financial Metric | H1 FY27 | H2 FY26 | H1 FY26 | YoY Change (%) | HoH Change (%) |
| Revenue from Operations | ₹242.96 Cr | ₹167.00 Cr | ₹130.06 Cr | +86.8% | +45.5% |
| Total Income (incl. Other Income) | ₹248.00 Cr | ₹168.00 Cr | ₹131.00 Cr | +89.3% | +47.6% |
| EBITDA | ₹28.98 Cr | — | ₹18.44 Cr | +57.2% | — |
| EBITDA Margin (%) | 11.93% | — | 14.18% | -225 bps | — |
| Profit Before Tax (PBT) | ₹27.00 Cr | ₹15.00 Cr | ₹18.00 Cr | +50.0% | +80.0% |
| Profit After Tax (PAT) | ₹20.08 Cr | ₹11.00 Cr | ₹12.92 Cr | +55.4% | +82.5% |
| PAT Margin (%) | 8.26% | 6.59% | 9.93% | -167 bps | +167 bps |
Decoding the Margin Dynamics
A deeper look at profitability reveals an important nuance that surface-level headlines miss:
- Absolute Profit Expansion: Generating ₹20.08 crore in net profit within a single six-month window means Maxvolt Energy earned nearly 84% of its entire FY26 full-year profit (₹24 crore) in just half a year.
- Sequential Margin Recovery: Net profit margin improved significantly from 6.59% in H2 FY26 to 8.26% in H1 FY27 (+167 basis points HoH), demonstrating better fixed-cost absorption as assembly plant utilization climbed.
- Why YoY Margins Normalized: Compared to H1 FY26, EBITDA margin moderated by roughly 225 basis points (from 14.18% to 11.93%). In lithium-ion battery assembly, rapid top-line scaling often involves onboarding larger OEM volume contracts at competitive pricing alongside upfront commissioning and import costs for new capacity. Retaining an ~12% EBITDA margin and >8% PAT margin while growing revenue by 87% indicates disciplined cost control.
2. Trailing Twelve Months (TTM) Trajectory vs. Full-Year FY26
Looking at Trailing Twelve Months (TTM) performance bridges the gap between historical full-year results and current run-rate capacity. Because SME companies report financial statements semi-annually rather than quarterly, TTM tracking is one of the most reliable tools for investors building comprehensive SME IPO analysis frameworks to spot inflection points early.
FY26 Full-Year vs. TTM Performance Snapshot
| Performance Parameter | Full-Year FY26 | Current TTM (H2 FY26 + H1 FY27) | Net Expansion | Growth Over FY26 |
| Total Revenue | ₹299.00 Cr | ₹416.00 Cr | +₹117.00 Cr | +39.1% |
| Profit After Tax (PAT) | ₹24.00 Cr | ₹31.00 Cr | +₹7.00 Cr | +29.2% |
| Implied Net Margin | 8.03% | 7.45% | -58 bps | — |
What the TTM Run-Rate Signals for H2 FY27
- Annualized Revenue Potential: H1 FY27 alone generated ₹242.96 crore in operational revenue. Even if H2 FY27 merely matches H1 execution without further sequential growth, Maxvolt Energy is positioned to cross ₹485–₹495 crore in full-year FY27 revenue—representing over 60% annual growth over FY26.
- Earnings Visibility: Similarly, sustaining H1 profitability puts full-year FY27 PAT on a trajectory toward ₹40+ crore, up from ₹24 crore in FY26.
- Operating Leverage Catalyst: As newly commissioned Energy Storage System (ESS) and battery recycling units begin contributing commercial revenue in H2 FY27, higher-margin value-added lines could offset interest expenses from elevated debt.
3. The Cash Flow and Debt Paradox: Why Operating Cash Flow Is -₹46.32 Crore
While income statement headlines celebrate an 87% jump in revenue, disciplined equity research requires examining the cash flow statement and balance sheet with equal rigor. For many retail investors, seeing negative cash flow alongside record profits feels contradictory—a concept explored in detail in our guide on how to read cash flow statements for high-growth companies.
In H1 FY27, Maxvolt Energy reported Operating Cash Flow (CFO) of -₹46.32 crore, widening from -₹29 crore in the prior period. Simultaneously, balance sheet liquidity tightened sharply:
- Total Debt: Increased to ₹134.70 crore.
- Cash and Bank Balances: Dropped to ₹0.38 crore.
- Net Debt Position: Stands at ₹134.32 crore (Total Debt minus Cash).
Why Does a Profitable Battery Maker Burn Operating Cash?
In lithium-ion battery pack manufacturing, rapid revenue growth consumes working capital before cash flows back into the bank account. Three operational realities explain this cash absorption:
- Raw Material Import Lead Times: Indian battery pack assemblers still import core lithium-ion cells, Battery Management System (BMS) semiconductors, and specialized thermal materials. Suppliers typically require advance letters of credit or short payment windows, tying up cash months before finished packs are billed.
- Inventory Build-Up for Order Execution: Scaling quarterly revenue run-rates from ~₹65 crore to over ₹120 crore requires holding substantially larger buffer stocks of cells and sub-assemblies to avoid assembly line stoppages.
- OEM Receivable Cycles: Supplying electric two-wheeler, three-wheeler, and commercial energy storage clients involves 45-to-90-day credit cycles. When H1 revenue surges by ₹113 crore YoY, a large portion of that incremental sales volume sits in trade receivables at the end of the half-year reporting date.
Evaluating Debt Serviceability and Liquidity Risk
To determine whether ₹134.70 crore in debt is manageable or excessive, investors can evaluate leverage relative to annualized operating cash earnings:
- Annualized EBITDA Run-Rate: Based on H1 FY27 EBITDA of ₹28.98 crore, annualized EBITDA stands at approximately ₹57.96 crore.
- Net Debt-to-Annualized EBITDA: $\text{₹134.32 Cr} \div \text{₹57.96 Cr} = \mathbf{2.32\text{x}}$.
A Net Debt-to-EBITDA ratio of 2.32x is moderate for an expanding industrial manufacturer, provided working capital converts into cash during the second half of the fiscal year. However, having only ₹0.38 crore in cash on hand leaves an extremely thin liquidity cushion. Any unexpected delay in customer collections or tightening in working capital credit limits could force additional short-term borrowing, increasing finance costs in H2 FY27.
4. ₹24 Crore Capex Utilization & Strategic Diversification Beyond EVs
Maxvolt Energy raised public capital through its SME IPO on the NSE Emerge platform in February 2025 at ₹180 per share. According to the company’s official fund utilization disclosures, 100% of the earmarked ₹24 crore capital expenditure has now been deployed across three strategic verticals and import procurement.
Breakdown of Maxvolt Energy’s ₹24 Crore Capex Deployment
| Capex Allocation Area | Amount Allocated | Share of Capex | Strategic Purpose & Business Impact |
| Energy Storage Systems (ESS) | ₹8.80 Cr | 36.7% | New battery assembly unit targeting commercial, industrial, and solar storage demand. |
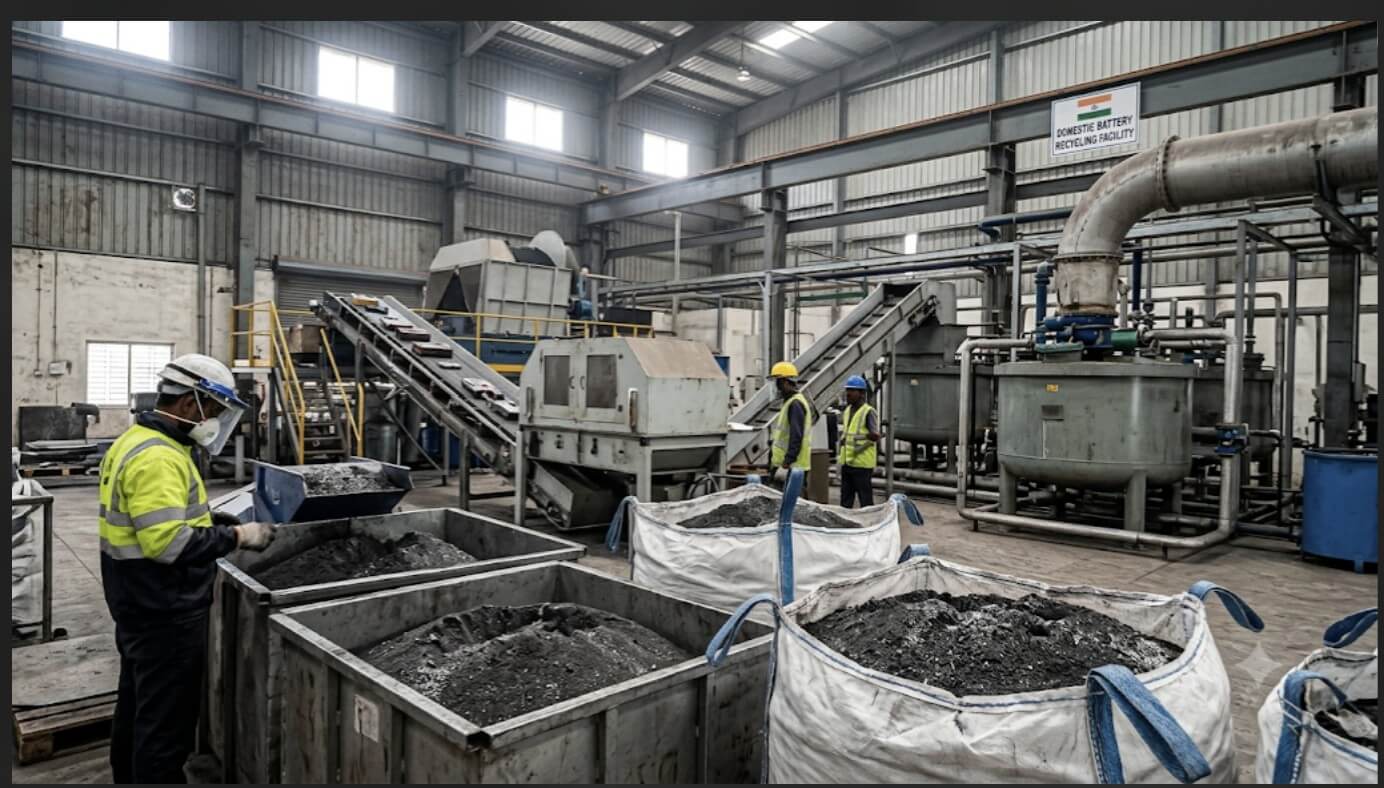
| Maxvolt Re-Earth (Recycling) | ₹8.30 Cr | 34.6% | Dedicated lithium-ion battery recycling facility for recovering battery black mass. |
| 2W EV Battery Plant Expansion | ₹4.00 Cr | 16.7% | Capacity expansion of existing electric two-wheeler lithium-ion assembly lines. |
| Import & Allied Setup Costs | ₹2.90 Cr | 12.1% | Machinery import duties, logistics, and commissioning expenses. |
| Total IPO Capex | ₹24.00 Cr | 100.0% | Fully utilized as per latest utilization report. |
Shifting Away From 96% EV Revenue Concentration
In FY25, roughly 96% of Maxvolt Energy’s revenue came from electric vehicle batteries—primarily serving India’s fast-growing electric 2W and 3W segments. While EV adoption provides tremendous volume growth, single-sector concentration exposes manufacturers to subsidy shifts, OEM price negotiations, and seasonal auto demand swings.
The ₹24 crore capex allocation directly addresses this concentration risk in two ways:
- Stationary Energy Storage (₹8.8 Cr): Commercial and industrial (C&I) solar installations, telecom towers, and microgrids increasingly rely on lithium-ion Energy Storage Systems (ESS) to replace lead-acid batteries. ESS contracts typically carry longer lifecycles and diversify Maxvolt’s customer base beyond automotive OEMs.
- Circular Economy Integration (₹8.3 Cr): By investing nearly 35% of its capex into Maxvolt Re-Earth, the company is building backward integration into lithium-ion battery recycling—a segment gaining regulatory urgency across India.
Investors tracking India’s broader clean-tech supply chain—including peers highlighted in our coverage of top EV sector stocks in India—should watch management’s disclosures on the exact FY27 revenue split between EV packs, ESS solutions, and recycling.
5. Maxvolt Re-Earth and the Lithium-Ion Black Mass Opportunity
Among all strategic initiatives inside Maxvolt Energy, Maxvolt Re-Earth (built with an ₹8.30 crore investment) stands out as the highest-potential margin catalyst—and the biggest information gap investors must track.
Why Battery Black Mass Recycling Matters
When end-of-life lithium-ion batteries or manufacturing scrap are shredded and processed mechanically, they yield a dark, mineral-rich powder known as battery black mass. This black mass contains concentrated lithium, cobalt, nickel, manganese, and graphite—the exact critical minerals India currently imports to manufacture new cells.
- Regulatory Tailwinds: Under India’s Battery Waste Management Rules and Extended Producer Responsibility (EPR) mandates, battery producers and importers must meet strict recycling and mineral recovery targets, creating guaranteed feedstock and demand for compliant recyclers.
- Processing Speed Advantage: Industry commentary surrounding Maxvolt Re-Earth highlights its capability to convert lithium-ion scrap into battery black mass at faster processing cycle times than established SME recycling peers such as Namo eWaste Management. Faster throughput lowers per-ton processing costs and accelerates inventory turns.
Critical Questions Investors Need Answered on Maxvolt Re-Earth
Because the ₹8.30 crore capex has been fully spent according to the utilization report, shareholders should look for clear management updates on four operational milestones:
- Commercial Commissioning Date: Has Maxvolt Re-Earth transitioned from trial runs to full commercial production in H2 FY27?
- Annual Processing Capacity: What is the installed metric-ton capacity per annum for lithium-ion pack dismantling and black mass extraction?
- Revenue Model: Will Maxvolt sell processed black mass directly to hydrometallurgical refiners, or enter tolling agreements with EV OEMs under EPR compliance contracts?
- Margin Contribution: Battery recycling typically commands healthier operating margins than pure battery pack assembly. Quantifying its EBITDA contribution will be vital for future valuation re-rating.
6. Valuation Analysis: From ₹180 SME IPO to 13.4x P/E at ₹386
Stock price rallies often make investors worry that a company has become expensive. However, Maxvolt Energy’s post-IPO trajectory demonstrates how rapid earnings growth can actually make a stock cheaper on a price-to-earnings (P/E) basis even after doubling in market price.
Valuation & Share Price Evolution Table
| Valuation Metric | At SME IPO (Feb 2025) | Pre-H1 FY27 Results | Post-H1 FY27 Results | Analytical Takeaway |
| Share Price | ₹180 | ~₹386 | ~₹386 | +114.4% return since IPO listing |
| Trailing PAT Basis | FY24 / Annualized | FY26 PAT (₹24 Cr) | TTM PAT (₹31 Cr) | Earnings expanded +29.2% over FY26 |
| Trailing P/E Multiple | — | ~17.3x | 13.4x – 13.6x | Multiple compressed by ~3.8x turns |
| Implied Market Cap | ~₹195 Cr | ~₹415 Cr | ~₹418 Cr | Valued at ~1.0x TTM Sales (₹416 Cr) |
Why P/E Compression Matters for Investors
- Earnings Catching Up to Price: Prior to the H1 FY27 release, at a share price of roughly ₹386, Maxvolt Energy traded at approximately 17.3x trailing earnings. Once the H1 FY27 net profit of ₹20.08 crore lifted TTM PAT to ₹31 crore, the trailing P/E multiple automatically compressed to 13.4x–13.6x.
- Attractive Price-to-Sales (P/S) Ratio: With TTM revenue at ₹416 crore and an implied market capitalization hovering near ₹415–₹420 crore, the stock trades at roughly 1.0x trailing sales—a modest multiple for a company growing revenue at 87% YoY.
- Peer Context: Listed Indian battery pack assemblers and battery recycling stocks in India frequently trade between 20x and 45x trailing earnings depending on balance sheet strength and SME versus mainboard liquidity. Maxvolt’s 13.4x P/E reflects a discount primarily driven by its negative operating cash flow and ₹134.70 crore debt load.
7. Industry Tailwinds, Risk Factors, and Investor Action Checklist
Macro & Policy Tailwinds Supporting Maxvolt Energy
India’s transition toward clean mobility and decentralized energy storage continues to enjoy strong structural and policy backing from the Ministry of Heavy Industries and central energy regulators:
- EV 2W & 3W Inflection: Electric three-wheelers have already achieved majority penetration across several Indian states, while electric two-wheelers continue expanding across Tier-2 and Tier-3 cities driven by lower total cost of ownership.
- PM E-DRIVE & PLI Ecosystem: Government incentives supporting commercial EV fleets, public charging infrastructure, and domestic Advanced Chemistry Cell (ACC) manufacturing create sustained downstream demand for reliable battery pack assemblers.
- Energy Storage Mandates: Rising renewable energy penetration is forcing commercial and industrial users to adopt lithium-ion battery storage systems to manage peak-hour tariffs and grid intermittency.
Key Risks Every Investor Must Weigh
Before making any investment decision, balance the growth story against four concrete risks:
- Working Capital & Liquidity Crunch: With cash reserves at ₹0.38 crore and CFO at -₹46.32 crore, Maxvolt has minimal room for receivable delays. If working capital does not release cash in H2 FY27, interest costs on ₹134.70 crore of debt will eat into net profits.
- Cell Price & Import Volatility: Because lithium-ion cells are imported, sharp swings in global lithium carbonate prices, foreign exchange (USD/INR) depreciation, or import duty revisions can compress gross margins if costs cannot be passed on immediately to OEMs.
- Low Barriers to Entry in Pack Assembly: Pure battery pack assembly has lower technological moats than cell manufacturing. Long-term margin protection depends on Maxvolt’s proprietary BMS engineering, ESS integration, and Maxvolt Re-Earth recycling execution.
- SME Exchange Liquidity Risk: Stocks listed on the NSE Emerge SME platform trade in fixed lot sizes and can experience sharp price gaps or lower liquidity during broader market corrections. Investors should also stay informed via SEBI investor education resources regarding SME market disclosures and governance standards.
5-Point Action Checklist for Tracking H2 FY27
If you are holding or researching Maxvolt Energy, use these five benchmarks to evaluate upcoming corporate announcements and H2 FY27 filings:
- Operating Cash Flow Turnaround: Watch whether CFO moves from -₹46.32 crore toward neutral or positive territory as H1 receivables are collected.
- Debt Reduction vs. EBITDA Growth: Track whether total debt stabilizes below ₹135 crore while EBITDA continues compounding.
- Maxvolt Re-Earth Commercial Update: Look for official management commentary on commissioning status, monthly black mass output, and initial recycling revenues.
- Revenue Mix Diversification: Check whether non-EV revenue (ESS + recycling) grows from 4% in FY25 toward 15–20% over the next 12 to 18 months.
- Margin Stability: Monitor whether EBITDA margins hold steady near 11.5%–12.5% despite higher interest outgo.
8. Frequently Asked Questions (FAQ) on Maxvolt Energy H1 FY27 Results
What was Maxvolt Energy’s revenue and net profit in H1 FY27?
In H1 FY27, Maxvolt Energy reported revenue from operations of ₹242.96 crore (up 86.8% YoY from ~₹130 crore in H1 FY26) and total income of ₹248 crore. Profit After Tax (PAT) rose 55.4% YoY to ₹20.08 crore, compared to ₹12.92 crore in H1 FY26 and ₹11 crore in H2 FY26.
Why is Maxvolt Energy’s operating cash flow negative despite strong profits?
Maxvolt Energy’s Operating Cash Flow (CFO) stood at -₹46.32 crore in H1 FY27 because rapid 87% revenue growth required substantial working capital lock-up. Importing lithium-ion cells ahead of production, holding higher inventory for order execution, and extending credit cycles to EV OEM customers absorbed cash faster than profits converted into bank balances.
How much debt does Maxvolt Energy have after H1 FY27?
Following H1 FY27, Maxvolt Energy’s total debt increased to ₹134.70 crore, while cash and bank balances stood at ₹0.38 crore. While its Net Debt-to-Annualized EBITDA ratio of ~2.32x remains manageable relative to operating earnings, improving cash conversion is a primary focus area for investors.
How has Maxvolt Energy utilized its ₹24 crore IPO capex?
According to the company’s fund utilization report, 100% of the ₹24 crore capex has been spent across four areas: ₹8.8 crore for a new Energy Storage System (ESS) assembly unit, ₹8.3 crore for the Maxvolt Re-Earth battery recycling plant, ₹4.0 crore for expanding its 2-wheeler EV battery facility, and ₹2.9 crore for import and setup costs.
What is Maxvolt Energy’s current P/E ratio at ₹386 per share?
At a share price of approximately ₹386, Maxvolt Energy’s trailing P/E multiple compressed from 17.3x down to 13.4x–13.6x after H1 FY27 earnings lifted Trailing Twelve Months (TTM) net profit to ₹31 crore.
Financial & Investment Disclaimer
This article is published strictly for educational and informational purposes and does not constitute investment, financial, legal, or tax advice. Maxvolt Energy Industries Limited is listed on the SME platform (NSE Emerge), where investments carry higher liquidity and volatility risks compared to mainboard equities. Financial figures are compiled from company H1 FY27 disclosures and market filings. Readers should conduct independent due diligence and consult a SEBI-registered investment advisor before making any investment decisions.
Disclaimer: This article is for informational and educational purposes only and does not constitute financial advice. Stock market investments are subject to market risks. Please consult with a registered financial advisor before making any investment decisions.
Disclaimer: This article is for educational purposes only and not financial advice. Investors should do their own due diligence before investing.
Disclaimer: The projections of potential returns are based on current market conditions and company performance. Actual results may vary due to various factors, including market dynamics, economic conditions, and changes in the competitive landscape. Investors should conduct their own research and consult with financial advisors before making investment decisions.
Multibagger Stocks breakout stocks
⚠️ Not SEBI Registered—just here to share insights | 🚫 No paid services—everything shared is entirely free! 🧠 Always Learning and excited to grow together in this journey of market exploration.
📲 Join Our Investor Communities
🔹 Join our Telegram Channel: Multibagger Hunts
🔹 Join our WhatsApp Channel: Click to Join
✅ Free access
✅ Instant alerts
✅ Curated research for serious investors
TwitterXWhatsAppThreadsTelegramFacebookLinkedInGmailEmailShare