admin
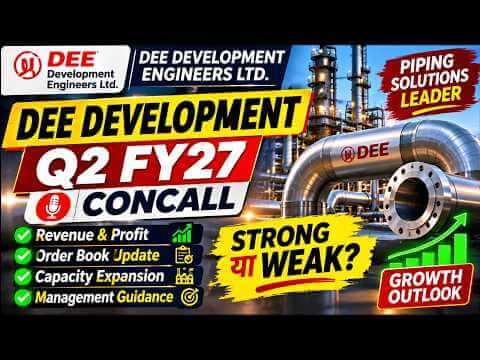
DEE Development Engineers Q2 FY27 Analysis: Record ₹2,600 Crore Order Book Powers ₹1,500 Crore FY27 Revenue Roadmap
DEE Development Engineers Limited (NSE: DEEDEV | BSE: 544198) has entered an operational inflection point following its Q2 FY27 earnings release and analyst conference call. While headline quarterly top-line growth appeared measured at 8.5% year-on-year (YoY), underlying operating profit surged 33.7% YoY, net profit jumped 31.8% YoY, and the company’s order backlog nearly doubled to roughly ₹2,600 crore.
For equity investors tracking India’s capital goods and process engineering cycle, this DEE Development Engineers Q2 FY27 analysis reveals a classic accounting-versus-execution divergence. Heavy reliance on customer-supplied “job-work” contracts held back reported revenue in the first half of FY27, masking substantial volume throughput across the company’s manufacturing facilities. With execution shifting decisively toward full-value “with-material” contracts in H2 FY27, management has reaffirmed its ambitious full-year target of ₹1,500 crore in revenue alongside operating profit margins (OPM) exceeding 19%.
In this comprehensive fundamental breakdown, we examine DEE Development’s Q2 and H1 FY27 financial scorecard, the mechanics behind its second-half revenue acceleration, multi-year catalysts from the Anjar facility and nuclear piping vertical, balance sheet deleveraging, peer positioning, and critical risks every investor must monitor.
Executive Summary: Key Takeaways from the Q2 FY27 Concall
- Strong Earnings & Margin Expansion: Q2 FY27 consolidated revenue stood at ₹292.99 crore (+8.5% YoY), while operating EBITDA rose 33.7% YoY to ₹58.9 crore, lifting operating margins by 379 basis points (bps) to 20.1%. Consolidated Profit After Tax (PAT) climbed 31.8% YoY to ₹23.45 crore.
- Reaffirmed FY27 Guidance: Management expressed high confidence in achieving ₹1,500 crore in FY27 revenue with an OPM above 19%. Having generated ₹587.4 crore in H1 FY27, DEE is poised to deliver over ₹910 crore in top-line revenue during H2 FY27.
- Explosive Order Book Growth: Total order backlog surged 93.5% YoY to ₹2,531.04 crore as of September 30, 2026, and expanded further to ₹2,586.43 crore (~₹2,600 crore) by late October 2026. H1 FY27 order inflows nearly doubled (+97.1% YoY) to ₹1,178.65 crore against full-year inflow guidance of ₹2,000 crore.
- Multi-Year Scale-Up (FY28 to FY30): Beyond FY27, management laid out a clear growth trajectory targeting ₹1,800+ crore in FY28 revenue and ₹2,500+ crore by FY30 under its Vision 2030 strategy.
- High-Margin Catalysts: Capacity ramp-up at the Anjar plant is guided to contribute ₹300 crore in FY28 revenue, while the newly approved nuclear piping vertical is projected to generate ₹50–60 crore in FY28 before scaling to ₹200 crore in FY29 at 25%+ EBITDA margins.
- Deleveraged Balance Sheet: Utilizing ₹225 crore from its ₹300 crore preferential issue to repay short-term debt trimmed Q2 finance costs by ~₹2 crore sequentially and earned a credit rating upgrade from CareEdge to CARE A; Stable / CARE A1.
Revenue Analysis: Decoding the H1 Job-Work Drag and H2 Acceleration
At first glance, a 19.0% YoY revenue increase in H1 FY27 (₹587.4 crore versus ₹493.6 crore in H1 FY26) might appear modest relative to the company’s full-year target of ₹1,500 crore. However, dissecting the contract mix explained during the Q2 FY27 earnings call clarifies why reported top-line growth lagged physical factory output.
How Job-Work Contracts Distort Top-Line Optics
In specialized process piping, contracts fall into two commercial structures:
- Job-Work (Conversion) Contracts: The client procures and supplies expensive alloy steel or stainless-steel seamless pipes directly to DEE Development. DEE performs high-precision engineering, bending, welding, heat treatment, and non-destructive testing, billing the client solely for conversion charges. Roughly 45% of H1 FY27 execution comprised job-work orders. Because the cost of raw steel—often 60% to 70% of a piping spool’s total value—is excluded from the invoice, reported revenue per metric tonne appears artificially compressed.
- With-Material (Turnkey) Contracts: DEE sources the raw alloy pipes, manufactures the customized piping systems, and bills the client for the entire landed value of the finished product.
Why H2 FY27 Will Witness a Material Top-Line Inflection
To hit its ₹1,500 crore FY27 revenue target, DEE Development must generate approximately ₹912.6 crore in H2 FY27—a sequential surge of more than 55% over H1 FY27. Management outlined three structural drivers supporting this second-half step-up:
- Pivot to Material-Inclusive Execution: Over 70% of H2 FY27 production is scheduled to come from “with-material” contracts entering active billing cycles from December 2026 onward. Even at similar shop-floor tonnage utilization, recognizing full material pass-through will substantially elevate invoiced revenue.
- Seasonal EPC Dispatch Schedules: Heavy capital goods and power infrastructure projects in India typically experience back-ended billing in Q3 and Q4 as client site readiness accelerates prior to fiscal year-end.
- Core Piping Dominance: The core process piping segment accounted for 92% of Q2 FY27 sales, growing 10.8% YoY in Q2 and 20.7% YoY in H1. Meanwhile, non-core biomass power generation revenue fell sharply due to regulatory tariff transitions, making the underlying growth of the core engineering division even stronger than consolidated headlines suggest.
| Financial Metric (Consolidated) | Q2 FY27 | Q2 FY26 | YoY Change | H1 FY27 | H1 FY26 | YoY Change |
| Revenue from Operations | ₹292.99 Cr | ₹270.04 Cr | +8.5% | ₹587.40 Cr | ₹493.61 Cr | +19.0% |
| Operating EBITDA | ₹58.90 Cr | ₹44.05 Cr | +33.7% | ₹108.67 Cr | ₹79.96 Cr | +35.9% |
| Operating EBITDA Margin | 20.1% | 16.3% | +379 bps | 18.5% | 16.2% | +230 bps |
| Profit After Tax (PAT) | ₹23.45 Cr | ₹17.79 Cr | +31.8% | ₹42.10 Cr | ₹32.94 Cr | +27.8% |
| PAT Margin | 8.0% | 6.6% | +141 bps | 7.2% | 6.7% | +50 bps |
Profitability & Margin Trends: Operating Leverage at Work
While revenue grew 8.5% YoY in Q2 FY27, operating EBITDA jumped 33.7% YoY to ₹58.9 crore, expanding operating margins to 20.1%. For investors evaluating earnings quality, this 379 bps margin expansion highlights powerful structural operating leverage across DEE Development’s manufacturing footprint.
Key Drivers of Margin Expansion
- Higher Capacity Utilization Against Flat Fixed Costs: As utilization ramped up at both the flagship Palwal (Haryana) campus and the new Anjar (Gujarat) plant, incremental gross profit flowed directly to EBITDA because fixed overhead and employee costs remained largely stable.
- Margin Mechanics of the H1 Job-Work Mix: Although job-work orders suppress top-line revenue, they carry higher percentage operating margins because there is no zero-margin raw material pass-through inflating the denominator. As H2 shifts back toward “with-material” billing, percentage OPM is expected to normalize slightly from Q2’s 20.1% peak, settling comfortably above management’s full-year floor of 19%+.
- Full-Year EBITDA Implications: Delivering ₹1,500 crore in FY27 revenue at a 19% OPM translates to approximately ₹285 crore in full-year EBITDA. Compared to roughly ₹196 crore in FY26 EBITDA, this implies an annual operating profit growth rate of ~45%.
- Interest Cost Reduction: Lower quarterly finance charges following debt repayment amplified operating profit gains into a 31.8% YoY surge in net profit.
Order Book & Inflow Trajectory: Unprecedented Revenue Visibility
In capital goods manufacturing, the order book-to-bill ratio is the single most reliable leading indicator of future earnings. On this front, DEE Development delivered standout numbers during the first half of FY27.
- Near-Doubling of Order Backlog: The consolidated closing order book stood at ₹2,531.04 crore on September 30, 2026—a 93.5% increase over ₹1,308.09 crore a year earlier. Subsequent October 2026 contract wins pushed the active backlog further to ₹2,586.43 crore (~₹2,600 crore).
- 1.72x Forward Revenue Coverage: Against the FY27 revenue guidance of ₹1,500 crore, a ₹2,586 crore order book provides roughly 1.72x forward revenue cover (or over 20 months of execution visibility at current run rates). You can learn more about evaluating backlog sustainability in our detailed guide on how to analyze order book-to-bill ratios in capital goods stocks.
- 97% Surge in H1 Order Inflows: Fresh order wins in H1 FY27 reached ₹1,178.65 crore, up 97.1% from ₹598.04 crore in H1 FY26. Cumulative inflows crossed ₹1,300 crore by October 2026, putting the company squarely on track to achieve its full-year FY27 order inflow guidance of ₹2,000 crore.
- Sectoral Diversification: Within the core piping backlog as of September 30, 2026, the Power sector accounted for ₹1,475.69 crore (driven by domestic supercritical thermal power upgrades and boiler piping), while Oil & Gas contributed ₹870.56 crore (spanning global refinery expansions, petrochemical complexes, and LNG terminals).
Strategic Growth Pillars: Anjar Ramp-Up, Nuclear Piping & Vision 2030
Management has articulated a clear multi-year roadmap aimed at scaling revenue from ₹1,500 crore in FY27 to ₹1,800+ crore in FY28 and ₹2,500+ crore by FY30 (representing an ~18.6% compound annual growth rate between FY27 and FY30). Two strategic growth engines underpin this long-term expansion.
1. The Anjar Facility Ramp-Up and Backward Integration
DEE Development’s 50-acre manufacturing complex at Anjar in Kutch, Gujarat, represents a structural competitive advantage. Located close to the major deep-water ports of Kandla and Mundra, Anjar drastically lowers inland freight expenses for heavy export piping spools.
- Backward Integration via Seamless Pipes: Alongside its expanded heavy fabrication bays, DEE commissioned a 7,000 metric tonnes per annum (MTPA) seamless pipe manufacturing plant at Anjar in March 2026. Producing high-grade alloy seamless pipes in-house reduces raw material lead times, eliminates third-party supplier bottlenecks, and captures upstream manufacturing margins.
- ₹300 Crore FY28 Revenue Target: As capacity utilization scales across both fabrication and seamless pipe rolling, management expects the Anjar facility alone to generate ₹300 crore in revenue during FY28.
- Plant Specialization: Shifting export and oil-and-gas fabrication to Anjar frees up capacity at DEE’s flagship Palwal plant in Haryana to focus exclusively on high-margin domestic supercritical thermal power orders.
2. High-Margin Nuclear Piping Import Substitution
The most compelling long-term margin catalyst highlighted in the Q2 FY27 concall is DEE Development’s entry into specialized nuclear power piping—a segment characterized by stringent regulatory qualification barriers and limited domestic competition.
- NPCIL Qualification & Joint Venture: DEE is an approved vendor for the Nuclear Power Corporation of India Limited (NPCIL) and is advancing toward financial closure on a dedicated nuclear piping joint venture aimed at domestic import substitution.
- Accelerated Revenue & Margin Trajectory: Management projects ₹50–60 crore in nuclear piping revenue in FY28, scaling rapidly to ₹200 crore in FY29. Crucially, nuclear-grade components command EBITDA margins exceeding 25%—more than 500 bps above the company’s blended average—which should structurally lift consolidated profitability over the next three years. For broader context on domestic atomic energy supply chains, explore our sector report on nuclear energy infrastructure stocks in India.
| Multi-Year Growth Roadmap | FY27 (Guided) | FY28 (Targeted) | FY29–FY30 (Vision 2030) | Key Strategic Drivers |
| Consolidated Revenue | ₹1,500 Cr | ₹1,800+ Cr (+20% YoY) | ₹2,500+ Cr (by FY30) | Full-material contract shift, export growth, capacity ramp-up |
| Operating Profit Margin | 19.0%+ | 19.0%–20.0%+ | 19.0%–20.0%+ | Operating leverage, seamless pipe backward integration |
| Anjar Facility Revenue | Ramping up | ₹300 Cr | Scaling toward peak | 7,000 MTPA seamless pipe plant + port-based export spools |
| Nuclear Piping Vertical | Pre-execution / JV | ₹50–60 Cr | ₹200 Cr in FY29 (25%+ OPM) | NPCIL approval, domestic import substitution |
| Annual Order Inflows | ₹2,000 Cr | ₹2,200+ Cr (Est.) | ₹2,800+ Cr (Est.) | Thermal capex, global refinery upgrades, data centers |
Balance Sheet Deleveraging and Credit Rating Upgrade
Capital-intensive engineering companies often struggle when rapid order book expansion collides with high debt servicing costs. DEE Development proactively addressed this constraint in mid-2026 through disciplined equity capital allocation.
- ₹225 Crore Debt Repayment: Following a ₹300 crore preferential equity issue in July 2026, the company deployed ₹225 crore directly toward retiring high-cost short-term borrowings.
- Immediate Finance Cost Savings: This deleveraging reduced quarterly interest expenses by approximately ₹2 crore quarter-on-quarter in Q2 FY27, providing an annualized interest savings run-rate of ₹8 crore before accounting for lower working capital borrowing rates.
- CareEdge Credit Rating Upgrade: On November 3, 2026, credit rating agency CareEdge upgraded DEE Development’s long-term bank facilities to CARE A; Stable (from CARE A-; Stable) and short-term facilities to CARE A1 (from CARE A2+) across ₹1,474.19 crore of rated debt. A higher credit rating lowers bank guarantee charges and letter-of-credit costs—critical competitive advantages when bidding for large global EPC tenders.
Investors can verify official quarterly disclosures and monitoring agency utilization reports directly via the DEE Development Engineers Investor Relations Portal, the NSE India DEEDEV Corporate Filings Page, and BSE India Financial Results for Scrip 544198.
Industry Outlook & Peer Benchmarking
India’s capital goods and industrial fabrication sector is benefiting from a synchronized multi-sector investment cycle spanning supercritical thermal power additions, refinery petrochemical expansions, liquefied natural gas (LNG) terminals, and emerging demand from hyperscale data centers and semiconductor fabrication plants.
Within this ecosystem, DEE Development Engineers occupies a specialized niche as India’s largest process piping solutions provider by installed capacity (and among the top five players globally). Unlike broad-based engineering, procurement, and construction (EPC) conglomerates that take on civil construction risk, DEE operates as a specialized, design-led manufacturing partner to global OEMs and EPC giants such as BHEL, EIL, L&T, and multinational energy contractors.
| Parameter | DEE Development (DEEDEV) | ISGEC Heavy Engineering | Praj Industries |
| Core Specialization | High-pressure process piping, induction bends, seamless pipes | Heavy engineering equipment, boilers, EPC projects | Bio-energy plants, process equipment, modular skids |
| Operating EBITDA Margin | ~18.5%–20.1% (H1/Q2 FY27) | ~8.5%–10.5% (Blended EPC/Mfg) | ~11.0%–13.5% |
| Order Book Visibility | ~1.72x FY27E Revenue (₹2,586 Cr) | ~1.4x–1.6x Annual Revenue | ~1.1x–1.3x Annual Revenue |
| Key Differentiator | Deep engineering moats, NPCIL nuclear approval, Anjar port proximity | Diversified heavy machinery & sugar/ethanol footprint | Global bio-fuel & engineering modularization leadership |
As shown in the comparison above, DEE Development’s pure-play manufacturing focus yields significantly higher operating margins (19%+) than diversified EPC peers whose blended margins are diluted by low-margin civil construction. For a broader view of sector valuations, read our Indian Capital Goods Sector Outlook for 2026–2027.
Key Risks and Red Flags Investors Must Watch
While the operational trajectory is compelling, balanced equity analysis requires scrutinizing potential headwinds and accounting nuances disclosed in the Q2 FY27 filings:
- H2 FY27 Execution Concentration Risk: Achieving ₹1,500 crore in full-year revenue requires generating over ₹912 crore in H2 FY27—roughly 1.55x the revenue booked in H1. Any delays in client site readiness, shipping vessel availability for export spools, or raw alloy steel procurement could push billing from Q4 FY27 into Q1 FY28.
- Working Capital Intensity from “With-Material” Shift: While job-work contracts in H1 required minimal working capital, pivoting over 70% of H2 execution to material-inclusive contracts will require higher inventory and receivables funding. Investors should monitor cash flow from operations and net working capital days in the March 2027 balance sheet.
- Qualified Audit Review on Malwa Power Subsidiary: The Q2 FY27 consolidated financial review carried an auditor qualification regarding a ₹50.63 crore asset impairment assessment at subsidiary Malwa Power Private Limited, stemming from ongoing electricity tariff litigation before the Appellate Tribunal for Electricity (APTEL) and the Punjab & Haryana High Court. Although the standalone piping business had an unmodified audit review and non-core biomass power represents less than 8% of sales, any adverse regulatory ruling could trigger a one-time non-cash write-down.
- Raw Material Price Volatility: Fixed-price “with-material” contracts carry margin sensitivity if specialty alloy steel or seamless pipe prices spike abruptly before procurement is locked in.
Investor Checklist: What to Track in Q3 and Q4 FY27
To validate whether DEE Development remains on track for its FY27 and FY28 milestones, investors should monitor four concrete quarterly indicators:
- Quarterly Revenue Run-Rate: Look for Q3 FY27 consolidated revenue to cross ₹400–430 crore, building toward a ₹480–500 crore finish in Q4 FY27 to meet the ₹1,500 crore annual target.
- Gross Margin Stability: Verify that the transition from job-work to “with-material” contracts keeps consolidated EBITDA margins firmly above the 19% threshold.
- Order Inflow Run-Rate: Track monthly exchange disclosures to confirm order inflows reach the ₹2,000 crore FY27 target (~₹700 crore needed between November 2026 and March 2027).
- Nuclear JV Financial Closure: Watch for formal announcements regarding financial closure of the nuclear piping joint venture and initial commercial order wins from NPCIL ahead of FY28.
Frequently Asked Questions (FAQs)
1. Why did DEE Development’s Q2 FY27 revenue grow only 8.5% YoY despite a doubling order book?
Approximately 45% of DEE Development’s H1 FY27 execution consisted of customer-supplied job-work contracts, where clients provide raw alloy steel pipes and DEE bills only for fabrication charges. As execution shifts to full-value “with-material” contracts from December 2026 onward, reported revenue is projected to accelerate sharply in H2 FY27.
2. What is DEE Development Engineers’ revenue and margin guidance for FY27 and FY28?
Management has guided for ₹1,500 crore in revenue with 19%+ operating profit margins in FY27, followed by ₹1,800+ crore in revenue in FY28. Under its Vision 2030 roadmap, the company aims to reach ₹2,500+ crore in revenue by FY30.
3. How big is DEE Development’s current order book?
As of September 30, 2026, DEE Development’s consolidated order book stood at ₹2,531.04 crore (+93.5% YoY), and rose further to ₹2,586.43 crore (~₹2,600 crore) by October 31, 2026. Full-year FY27 order inflows are guided at ₹2,000 crore.
4. How much will the Anjar facility and nuclear piping contribute to future growth?
Management expects the Anjar plant (including its 7,000 MTPA seamless pipe unit) to generate ₹300 crore in revenue in FY28. Meanwhile, the high-margin nuclear piping division is projected to contribute ₹50–60 crore in FY28 and scale to ₹200 crore in FY29 with EBITDA margins above 25%.
5. How did DEE Development reduce its debt in FY27?
DEE Development raised ₹300 crore through a preferential issue in July 2026 and used ₹225 crore to repay short-term borrowings. This lowered Q2 FY27 finance costs by ~₹2 crore sequentially and prompted CareEdge to upgrade the company’s credit ratings to CARE A; Stable / CARE A1.
Disclaimer: This equity research article is published for informational and educational purposes only and does not constitute investment advice, a stock recommendation, or a solicitation to buy or sell securities. Stock market investments are subject to market risks. Readers should consult a SEBI-registered financial advisor and review official exchange filings before making investment decisions.
Disclaimer: The projections of potential returns are based on current market conditions and company performance. Actual results may vary due to various factors, including market dynamics, economic conditions, and changes in the competitive landscape. Investors should conduct their own research and consult with financial advisors before making investment decisions.
Multibagger Stocks breakout stocks
⚠️ Not SEBI Registered—just here to share insights | 🚫 No paid services—everything shared is entirely free! 🧠 Always Learning and excited to grow together in this journey of market exploration.
📲 Join Our Investor Communities
🔹 Join our Telegram Channel: Multibagger Hunts
🔹 Join our WhatsApp Channel: Click to Join
✅ Free access
✅ Instant alerts
✅ Curated research for serious investors
TwitterXWhatsAppThreadsTelegramFacebookLinkedInGmailEmailShare