admin
Smart Silver Investing Strategy: How to Profit from Volatility Without Getting Trapped
Silver has a unique talent for humbling retail investors. In early 2026, spot silver surged to record highs above $117 per ounce before suffering two violent single-day crashes of over 25% each, ultimately shedding roughly 50% of its peak value by autumn.
When prices plunge at that speed, untrained investors fall into a predictable psychological spiral. They buy blindly at every 10% drop, recite bullish headlines about solar panels and artificial intelligence to justify mounting losses, and eventually stop opening their brokerage accounts altogether.
A smart silver investing strategy flips that behavior on its head. Instead of treating price drops as automatic bargains, disciplined investors separate long-term industrial narratives from short-term liquidity cycles, macro interest rates, and position-sizing math.
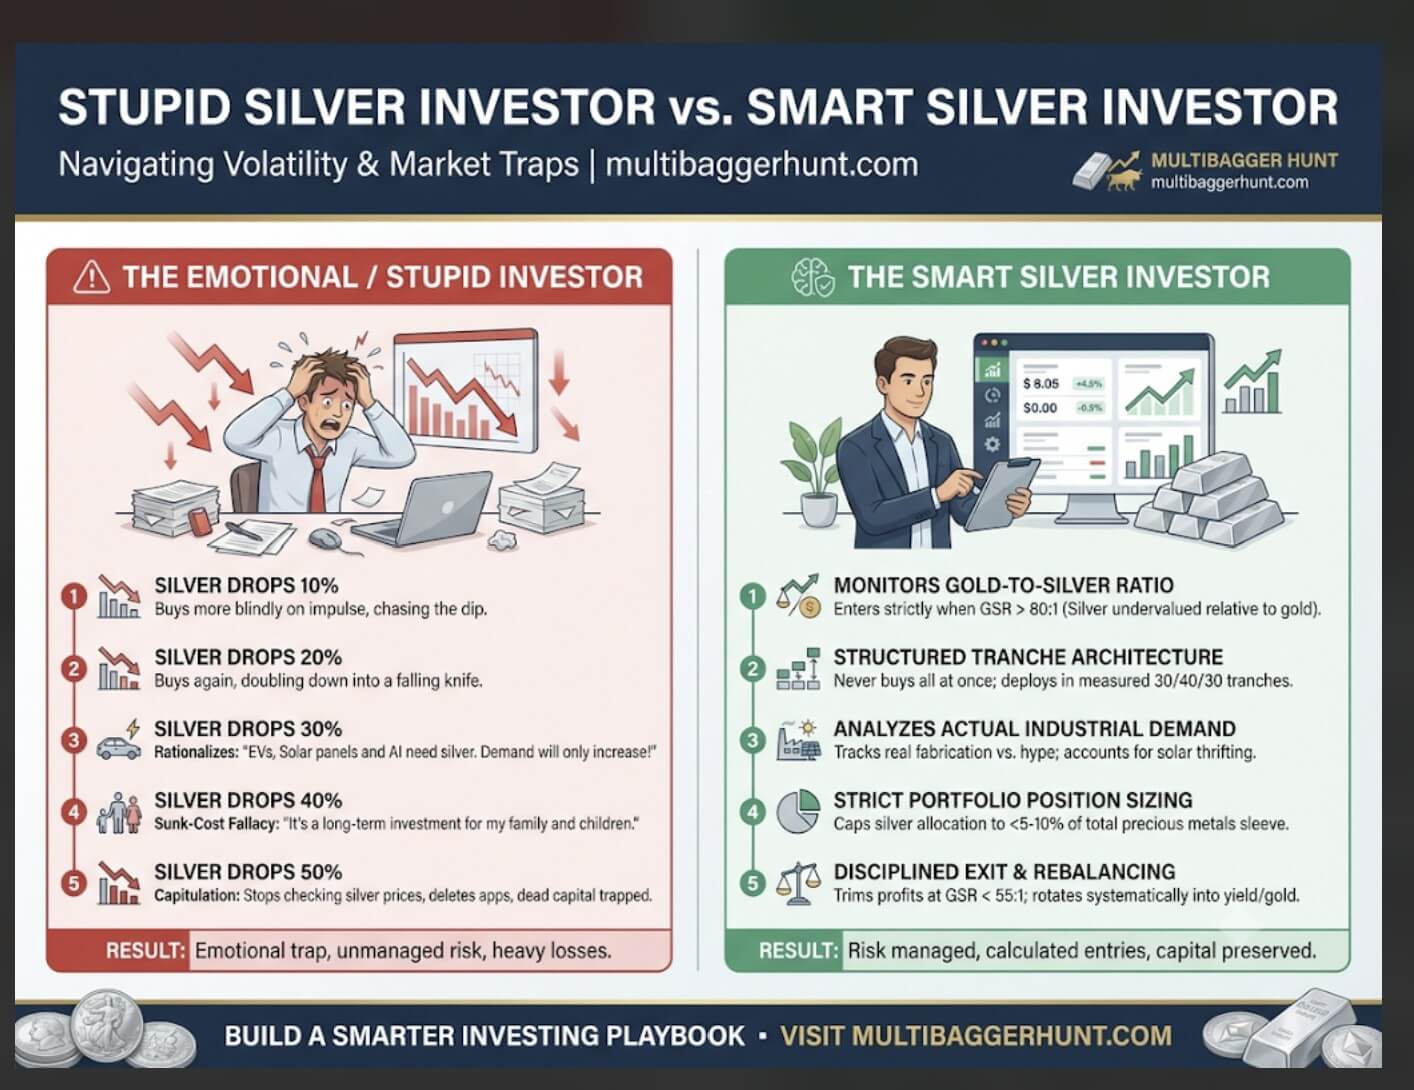
The Psychology of a Crash: Emotional vs. Smart Silver Investors
Most losses in precious metals do not come from choosing the wrong asset. They come from poor capital allocation during high-volatility drawdowns.
Because silver trades in a much smaller market than gold, capital inflows and outflows trigger exaggerated price swings. Since 2013, silver has recorded an annualized volatility of 31.8%, roughly double gold’s 15.9%. When you apply a static “buy the dip” mentality to a high-beta commodity, small mistakes compound quickly.
| Drawdown Stage | Emotional Silver Investor Behavior | Smart Silver Investor Behavior |
| Down 10% | Deploys remaining cash immediately to lower average cost without checking trend structure. | Holds initial starter position; waits for volatility to compress and technical support to hold. |
| Down 20% | Doubles down using emergency savings or margin, assuming the sell-off is temporary noise. | Evaluates real Treasury yields, US dollar liquidity, and futures positioning before adding capital. |
| Down 30% | Repeats bullish themes (“EVs, solar, and AI guarantee higher prices”) to ignore portfolio risk. | Separates unit demand from metal intensity; checks if high prices triggered industrial thrifting. |
| Down 40% | Shifts thesis from a tactical trade to a “generational hold for the kids” (sunk-cost fallacy). | Reviews pre-defined invalidation levels; harvests tax losses or hedges downside via options. |
| Down 50% | Deletes trading apps, stops tracking prices, and holds dead capital for years waiting to break even. | Rebalances systematically using the Gold-to-Silver Ratio once capitulation volume peaks. |
Why “Averaging Down” Fails in Commodities
Averaging down works reasonably well in broad stock market index funds because corporate earnings grow over decades. Commodities do not generate cash flows, pay dividends, or compound earnings.
- Asymmetric Recovery Math: A 10% loss requires an 11.1% gain to recover. A 50% loss requires a 100% gain just to return to your entry price.
- Opportunity Cost: Capital locked in an underwater silver position cannot earn yield in short-term bonds or capture uptrends in other sectors.
- Margin and Liquidity Stress: Leveraged silver products, futures contracts, and mining equities can wipe out accounts long before the long-term bullish thesis plays out.
To build a durable portfolio, you must replace narrative comfort with measurable market data. For a broader look at structuring precious metals alongside equities, read our Precious Metals Portfolio Allocation Guide.
Pillar 1: Industrial Demand Reality vs. Hype (Solar, EVs, and AI)
The most dangerous trap in silver investing is confusing technology adoption with metal consumption. Just because global solar installations, electric vehicles (EVs), and artificial intelligence (AI) data centers are expanding does not mean silver demand rises in a straight line.
According to the World Silver Survey by The Silver Institute, global industrial silver fabrication reached a record 680.5 million ounces in 2024. However, industrial demand eased by 3% to 657.4 million ounces in 2025 and is projected to dip another 3% to 639.6 million ounces in 2026.
The Hidden Threat of Solar Thrifting
Photovoltaic (solar) manufacturing is silver’s largest single industrial growth engine, consuming 197.6 million ounces in 2024 (nearly 29% of total industrial demand). Yet when silver prices spike rapidly, solar manufacturers aggressively engineer silver out of every cell—a process known as thrifting.
- Unit Intensity Drops: Engineers switch to thinner silver pastes, copper-plating alternatives, and advanced cell architectures to protect profit margins.
- Volume vs. Loading: Global solar capacity can hit all-time highs while total silver used by the solar sector falls by double digits.
- Price Elasticity: High silver prices actively destroy near-term industrial demand until manufacturers adapt their supply chains.
Where Real Growth Lives: EVs and AI Infrastructure
While solar loadings fluctuate, two other sectors provide steady structural support for industrial fabrication:
- Automotive Electrification: Internal combustion vehicles use roughly 15 to 28 grams of silver, whereas battery-electric vehicles (BEVs) require between 25 and 50 grams per vehicle for battery management systems, sensors, and power electronics. Oxford Economics projects automotive silver demand to grow roughly 3.4% annually through 2031.
- AI Data Centers and Grid Upgrades: Artificial intelligence clusters require massive electrical transmission infrastructure, high-frequency connectors, and thermal management components. Because silver possesses the highest electrical and thermal conductivity of any metal, engineers rely on it where energy efficiency is critical.
A smart investor tracks quarterly industrial fabrication data rather than repeating social media slogans during a 30% market correction. You can compare silver’s industrial footprint against copper and platinum in our Industrial Metals Demand Analysis.
Pillar 2: Supply Inelasticity and Above-Ground Deficits
Understanding silver’s supply side reveals why the metal experiences violent boom-and-bust cycles. Unlike gold or oil, primary silver mines account for only about 26% of global mined output.
Roughly 74% of all newly mined silver is produced as a byproduct of copper, lead, zinc, and gold mining.
Why Mine Supply Cannot React Quickly
- Inelastic Production: If silver prices double, a copper or zinc miner will not automatically dig up more ore unless copper or zinc prices also justify the capital expenditure.
- Rising Extraction Costs: In the first half of 2026, average all-in sustaining costs (AISC) for primary silver mines jumped 47% to $16.27 per ounce due to declining ore grades, higher energy expenses, and royalties.
- Multi-Year Structural Deficits: The global silver market recorded its sixth consecutive annual supply deficit in 2026, with cumulative shortfalls between 2021 and 2026 removing roughly 746 to 762 million ounces from above-ground stockpiles.
- Recycling Lag: Secondary scrap recycling rises when prices surge—reaching an estimated 210 million ounces in 2026—but industrial scrap recovery takes months to refine and return to market.
Because supply is rigid and industrial demand is sticky in the short term, investment flows act as the marginal price setter. When retail buyers, hedge funds, and exchange-traded products (ETPs) rush in simultaneously, silver spikes vertically. When speculative money exits, prices collapse until physical vault drawdowns tighten liquidity again.
Pillar 3: Mastering the Gold-to-Silver Ratio and Macro Triggers
Smart silver investors never analyze silver in a vacuum. They anchor their entry and exit decisions to two objective benchmarks: the Gold-to-Silver Ratio (GSR) and real interest rates.
How to Use the Gold-to-Silver Ratio
The Gold-to-Silver Ratio measures how many ounces of silver it takes to purchase one ounce of gold. You calculate it by dividing the current spot price of gold by the spot price of silver.
Historically, the ratio swings between predictable valuation bands:
- Above 80:1 (Silver Undervalued vs. Gold): Historically, readings above 80 signal that silver is cheap relative to gold. During the March 2020 liquidity panic, the ratio spiked to a modern record near 126:1 before silver rallied more than 140% over the next five months.
- 70:1 to 80:1 (Neutral Equilibrium Band): Between 2013 and 2026, the median Gold-to-Silver Ratio hovered near 77.9:1, with nearly 70% of trading sessions closing between 70 and 90.
- Below 50:1 (Silver Overextended vs. Gold): When silver enters a speculative mania, the ratio compresses sharply. In late January 2026, the ratio fell to 45.88:1 right before silver suffered a 50% drawdown.
Instead of buying silver every time it drops 10% from a speculative peak, smart investors wait until the Gold-to-Silver Ratio climbs back above 80:1 before rotating capital from gold or cash into silver. Explore historical ratio charts in our Gold vs. Silver Ratio Guide.
Macroeconomic Liquidity Indicators
Silver trades at the intersection of monetary policy and global manufacturing. Before deploying capital, check three macro indicators on CME Group’s Precious Metals Market Portal:
- US 10-Year TIPS (Real Yields): Because silver pays zero interest, rising inflation-adjusted Treasury yields increase the opportunity cost of holding bullion and pressure prices downward.
- Global Manufacturing PMI: Readings above 50 indicate industrial expansion, supporting physical fabrication demand across electronics and automotive supply chains.
- COT (Commitment of Traders) Positioning: When managed money futures accounts hold extreme net-long positions, the market is vulnerable to long-liquidation cascades. Conversely, extreme net-short commercial hedging often marks durable cycle bottoms.
Pillar 4: Position Sizing, Tranche Rules, and Risk Management
Even with accurate fundamental research, poor position sizing will destroy your returns. A disciplined smart silver investing strategy treats risk management as a mathematical formula rather than a gut feeling.
Step 1: Volatility-Adjusted Portfolio Weighting
Because silver moves roughly 1.6 to 2 times as much as gold on any given macro shock, holding equal dollar amounts of gold and silver exposes your portfolio to heavy silver-driven drawdowns.
- Cap Total Precious Metals: Limit combined gold and silver holdings to 5%–10% of your total investable net worth, depending on your risk tolerance.
- Apply a 2:1 or 3:1 Gold-to-Silver Split: Within your metals sleeve, allocate 65%–75% to gold for stability and 25%–35% to silver for upside torque.
- Never Use High Leverage: Avoid leveraged silver ETFs or thinly margined futures unless you are executing short-term tactical trades with automated stop-loss orders.
Step 2: Structured Tranche Architecture
Instead of buying every 10% dip blindly, divide your intended silver allocation into three distinct tranches tied to technical and valuation triggers:
| Tranche | Allocation % | Entry Trigger Requirement | Risk Control Rule |
| Tranche 1 (Core Starter) | 30% of target | Price pulls back to a major 200-day moving average or multi-month support zone. | Size small enough that a 20% further drop impacts total net worth by less than 0.5%. |
| Tranche 2 (Confirmation) | 40% of target | Selling volume exhausts, weekly RSI recovers from oversold levels, and GSR exceeds 80:1. | Do not deploy while price is making lower daily lows on expanding volume. |
| Tranche 3 (Trend Strength) | 30% of target | Price breaks back above key resistance with rising industrial PMI and falling real yields. | Add into confirmed upward momentum rather than catching falling knives. |
Step 3: Profit-Taking and Rebalancing Discipline
Emotional investors hold silver all the way up and all the way back down because they lack an exit plan. Establish automated trimming rules before you buy:
- Trim at Ratio Extremes: Whenever the Gold-to-Silver Ratio drops below 55:1, sell 25%–50% of your silver position and rotate the proceeds into gold or short-duration Treasury bills.
- Rebalance Annually: If a silver rally pushes your precious metals sleeve from 8% to 14% of your portfolio, trim the excess back to your baseline target to lock in gains.
Pillar 5: Choosing the Right Silver Investment Vehicle
How you buy silver matters almost as much as when you buy it. High dealer markups, poor liquidity, or operational mining risks can turn a winning market call into a losing trade.
| Vehicle Type | Best Use Case | Key Advantages | Major Risks & Friction |
| Physical Bullion (Coins & Bars) | Long-term wealth insurance and systemic tail-risk protection. | Zero counterparty risk; direct physical ownership. | High dealer premiums (5%–15% over spot), storage costs, and wide bid-ask spreads. |
| Physically Backed ETFs / ETPs | Tactical swing trading, portfolio rebalancing, and IRA accounts. | Instant intraday liquidity, tight spreads, and low annual expense ratios (0.30%–0.50%). | Ongoing management fees; no direct physical delivery for retail share sizes. |
| Primary Silver Mining Stocks | Aggressive bull-market leverage during rising margin cycles. | Operating leverage (in H1 2026, primary miner margins surged 187% as prices rose). | Operational disruptions, share dilution, geopolitical risk, and equity market correlation. |
| Silver Royalty & Streaming Firms | Lower-risk equity exposure to rising silver prices. | Fixed-cost metal purchase contracts protect margins against mining inflation. | Valuation premiums; still subject to broader stock market drawdowns. |
Before purchasing exchange-traded commodities or mining equities, review the U.S. SEC Investor.gov Guide on Commodity Risks to verify custodian structures and tax treatments in your jurisdiction.
Actionable 6-Step Checklist Before Buying Silver
Use this pre-trade checklist on desktop or mobile before committing new capital to any silver position:
- Check Your Portfolio Cap: Confirm that adding silver will keep your total precious metals allocation below your maximum risk threshold (typically 5%–10% of net worth).
- Verify the Gold-to-Silver Ratio: Check whether the ratio sits above its historical median of roughly 78:1, signaling favorable relative value.
- Assess Macro Liquidity: Ensure real interest rates and the US dollar are stabilizing rather than breaking out to multi-year highs.
- Wait for Technical Stabilization: Require at least two consecutive higher weekly closes or a confirmed bounce off major support before deploying Tranche 2 capital.
- Calculate Transaction Friction: Compare physical dealer premiums against liquid ETF spreads so fees do not eat your first 10% of upside.
- Write Down Your Exit Rule: Define both your invalidation stop-loss level and your Gold-to-Silver Ratio profit-taking target in advance.
Frequently Asked Questions About Smart Silver Investing
Why does silver drop faster than gold during market sell-offs?
Silver has a smaller total market capitalization than gold and derives roughly 58% of its demand from industrial fabrication. During economic slowdowns or liquidity crunches, investors sell silver both as a cyclical industrial metal and to raise cash, causing it to fall roughly 1.5 to 2 times faster than gold.
Is silver a good long-term investment for retirement or children?
Silver works well as a satellite inflation hedge and currency diversifier, but it should not replace productive, cash-flowing assets like diversified equities or real estate. Because silver can experience multi-year sideways or downward cycles, holding an oversized, unmanaged position creates severe opportunity cost.
Should I buy physical silver coins or silver ETFs?
Choose physical coins or bars for long-term crisis insurance where you never plan to trade actively. Choose physically backed silver ETFs if you want to execute a smart silver investing strategy that relies on low transaction costs, rapid rebalancing, and tax-loss harvesting.
Does solar panel growth guarantee higher silver prices?
No. While solar installations continue to expand globally, solar cell manufacturers actively reduce the milligrams of silver used per watt whenever silver prices rise. Smart investors monitor net silver ounces consumed by photovoltaics alongside mine supply deficits and investment inflows rather than relying on solar headlines alone.
Disclaimer: The projections of potential returns are based on current market conditions and company performance. Actual results may vary due to various factors, including market dynamics, economic conditions, and changes in the competitive landscape. Investors should conduct their own research and consult with financial advisors before making investment decisions.
Multibagger Stocks breakout stocks
⚠️ Not SEBI Registered—just here to share insights | 🚫 No paid services—everything shared is entirely free! 🧠 Always Learning and excited to grow together in this journey of market exploration.
📲 Join Our Investor Communities
🔹 Join our Telegram Channel: Multibagger Hunts
🔹 Join our WhatsApp Channel: Click to Join
✅ Free access
✅ Instant alerts
✅ Curated research for serious investors
TwitterXWhatsAppThreadsTelegramFacebookLinkedInGmailEmailShare